Ryzen: Strictly technical

Page 42 - Seeking answers? Join the AnandTech community: where nearly half-a-million members share solutions and discuss the latest tech.
Status
Not open for further replies.

Abwx

Lifer
Apr 2, 2011
10,947
3,457
136
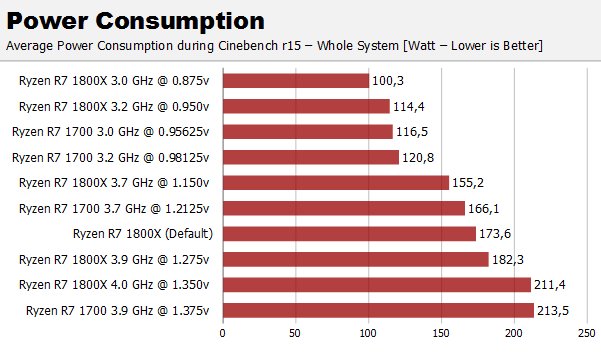
The voltages could be flatish as the clocks are bellow the range shown in the first graph.
You do seem to be confusing the cores and the SoC while also assuming that CB scales perfectly with clocks.
As for Computerbase and 76W delta at the main, the review here does a bit better than that. "All of the power consumption measurements have been made with DCR method. The figures represent the total combined power consumed by the CPU cores (VDDCR_CPU, Plane 1) and the data fabric / the peripherals (VDDCR_SOC, Plane 2). These figures do not include switching or conduction losses."

Measurements made by BC confirm my sayings :

C6hGF7bWgAAmpVG.jpg

Idle power is 44.2W, so including the CPU idle power this latter use at most 55W@3GHz@0.875V, the CB score is 1338pts.

Now keep this voltage as it is but reduce frequency to 1.9GHz, the score will be 850pts and power will be 55 x 19/30 = 34.8W...

So power at 850pts/1.9GHz has been artificialy inflated for some reason.

You can compare two measurements above and deduce the rate of power increasement vs frequency if you want, FI the two lower numbers displayed yield a theorical ratio delta of :

(3/3.2)(0.875/0.95)^2 = 0.795

Taking the higher value wich is 78W delta this yield 62W while the actual measurement is 64W, so theory and practice agree here..
 

imported_jjj

Senior member
Feb 14, 2009
660
430
136
Measurements made by BC confirm my sayings :

C6hGF7bWgAAmpVG.jpg

Idle power is 44.2W, so including the CPU idle power this latter use at most 55W@3GHz@0.875V, the CB score is 1338pts.

Now keep this voltage as it is but reduce frequency to 1.9GHz, the score will be 850pts and power will be 55 x 19/30 = 34.8W...

So power at 850pts/1.9GHz has been artificialy inflated for some reason.

You can compare two measurements above and deduce the rate of power increasement vs frequency if you want, FI the two lower numbers displayed yield a theorical ratio delta of :

(3/3.2)(0.875/0.95)^2 = 0.795

Taking the higher value wich is 78W delta this yield 62W while the actual measurement is 64W, so theory and practice agree here..

What are you smoking? You completely ignore my answer and come up with more non evidence.
 
  • Like
Reactions: looncraz

Abwx

Lifer
Apr 2, 2011
10,947
3,457
136
What are you smoking? You completely ignore my answer and come up with more non evidence.

What i came with are elements that show that your objections are not justified and that the factors you are talking about have no great influence, the CPU behave like a capacitor that would have a constant value, meaning that the power it dissipate is mainly a function of frequency and voltage, linearly in respect of frequency and as a square re to voltage, FTR the total capacitance of the CPU (in Cinebench..) can be estimated to 2.8 nanofarad...
 

tamz_msc

Diamond Member
Jan 5, 2017
3,795
3,626
136
What i came with are elements that show that your objections are not justified and that the factors you are talking about have no great influence, the CPU behave like a capacitor that would have a constant value, meaning that the power it dissipate is mainly a function of frequency and voltage, linearly in respect of frequency and as a square re to voltage, FTR the total capacitance of the CPU (in Cinebench..) can be estimated to 2.8 nanofarad...
The Stilt's graphs clearly indicate that the range of CB multi-threaded scores are obtained when the CPU is operating below the first critical point, where voltage is proportional to Fmax.

Hence, power prop. to V^2 ie. power prop. to Fmax^2. Assuming perfectly linear relationship in the CB scores with Fmax (which I'm willing to bet isn't the case in the real world), we have CB score prop. to sqrt(power), which is clearly reflected in the graph.

Also, why do you use polynomial fitting for data that is perfectly linear, as you state in your previous post? Open up your favorite curve-fitting tool and put some real data in it and see for yourself "better fits" with higher degree polynomials. Of course any conclusion you draw from that fit without knowing the expected behavior of the data is going to be wrong.

Plot y=x and y=x^n and see for yourself which is ahead for different x.
 

imported_jjj

Senior member
Feb 14, 2009
660
430
136
What i came with are elements that show that your objections are not justified and that the factors you are talking about have no great influence, the CPU behave like a capacitor that would have a constant value, meaning that the power it dissipate is mainly a function of frequency and voltage, linearly in respect of frequency and as a square re to voltage, FTR the total capacitance of the CPU (in Cinebench..) can be estimated to 2.8 nanofarad...


Ok lets focus on the SoC vs cores confusion.
VCORE is representative for the cores and cache scaling but that excludes all else and that appears to be some 10W+ with minimal scaling in this particular case - DRAM OC and an app that is not BW hungry.
 
Last edited:

looncraz

Senior member
Sep 12, 2011
722
1,651
136
What i came with are elements that show that your objections are not justified and that the factors you are talking about have no great influence, the CPU behave like a capacitor that would have a constant value, meaning that the power it dissipate is mainly a function of frequency and voltage, linearly in respect of frequency and as a square re to voltage, FTR the total capacitance of the CPU (in Cinebench..) can be estimated to 2.8 nanofarad...

You are making this a LOT more complicated than it needs to be.

The two charts use entirely different scales AND metrics.

You have to match up the scales and metrics before you can compare.

2Ghz
CB Score: 600
Wattage: 27.5W

3.3Ghz:
CB Score: 990
Wattage: ~35W

Aside from wattage, frequency and scores are both 65% higher and both align with the curves on the charts.

If these values are power draw over idle, than these seem quite close to reality - 3.3Ghz = 65W.

My own testing suggests uncore is ~20W. VRM efficiency can explain the rest - including the seeming disparity between the curve as VRMs are not uniformly efficient, either.

To further complicate things you have a CPU which needs quite a bit more voltage at 3.5GHz than it does at 3.3Ghz, so power draw would then increase much faster than frequency, which would flatten the score/W chart.

The two charts are entirely compatible. Not that is means they have been proven correct - just that there's by no means enough information to debunk either of them.
 
  • Like
Reactions: Drazick

tamz_msc

Diamond Member
Jan 5, 2017
3,795
3,626
136
I also clearly see 4 "bumps" - 2 major, 2 minor in the graph. It's linear at each and every one of those points, till you reach the next one, with varying slopes.

Which seems to me this is a "hand drawn" fit to get a similar profile as y=sqrt(x).
 

looncraz

Senior member
Sep 12, 2011
722
1,651
136
NewEgg is awesome - my replacement board is due Wednesday.

I am putting some of the finishing touches on my latency testing and trying to see how my tests compare to others'.

I have written the code to be cross-platform, so it runs on Windows and Linux - which will help to nail down some OS-related overhead.
 

ryzenmaster

Member
Mar 19, 2017
40
89
61
So I've read a good deal about possible problems with Windows 10 scheduler and how it may not be properly handling the two CCX design. Despite AMD already releasing a statement claiming there is no problem with scheduling under Windows, I decided to do a little experiment of my own and write a small benchmark in C++.

More testing. This time I had all 4 threads referencing the same tree instance, which lead to some interesting results:

I tried to force less than optimal scenario by setting affinity to 0,2,8,10 and referencing same instance on all threads. Having one copy means that it can only reside in cache of one CCX at a time so with affinity set to run threads on both CCX we are bound to see increased latencies. Indeed quite frequently all threads have their latencies at around ~600-700ns. There is much more variation between runs compared to optimal scenario with two copies and affinity, where the latencies sit at around ~350ns on all threads. Though there is more variation with single copy, there is also consistency between the threads and their latencies tend to be within 20ns from one another.

So what about all 4 referencing same instance without affinity? Interesting enough results here are much the same as with 0,2,8,10 affinity. Similar latencies between ~600-700ns and similar consistency between threads.

Ok what about all 4 referencing same instance using one CCX with 0,2,4,6 affinity? Well just like you might expect, results are back to ~350ns on all threads given that again we have an optimal scenario with data residing in cache of same CCX as thread execution.

Last one I tested this time around was affinity of 0,1,2,3 meaning we stick to one CCX but only two physical cores. Once again consistent results with all threads at around ~450ns latency. Only some 100ns more than with 4 physical cores. SMT seems to be doing what it was built for here; context switching at blazing speeds :)
 

Abwx

Lifer
Apr 2, 2011
10,947
3,457
136
Also, why do you use polynomial fitting for data that is perfectly linear, as you state in your previous post? Open up your favorite curve-fitting tool and put some real data in it and see for yourself "better fits" with higher degree polynomials. Of course any conclusion you draw from that fit without knowing the expected behavior of the data is going to be wrong.

Plot y=x and y=x^n and see for yourself which is ahead for different x.

8Rch6JF.png


Plot this curve and tell us what is the rate of power vs frequency/voltage displayed here and how much more power is required at 3.2GHz in respect of 1.9GHz...

You will conclude that the rate of change is a polynomial of degree 2.56 in respect of frequency between 2.1 and 3.27GHz, and that the power at 3.2GHz is 3.33x the power at 1.9GHz, if the chip did actually require 35W at 1.9 then it would be over 110W at 3.2, and we know that it s within 65W at this frequency...

Physics and maths do not lie when they are understood correctly, and since the chip is at 65W at 3.2 then it means that it s at 20W at 1.9GHZ, and that the score is 850 at this power, and not at 35W.
 

tamz_msc

Diamond Member
Jan 5, 2017
3,795
3,626
136
Physics and maths do not lie when they are understood correctly, and since the chip is at 65W at 3.2 then it means that it s at 20W at 1.9GHZ, and that the score is 850 at this power, and not at 35W.

I understand it alright - when 60% of a graph is linear, you would not want to use polynomial fitting and get incorrect extrapolated results.
 

Abwx

Lifer
Apr 2, 2011
10,947
3,457
136
I understand it alright - when 60% of a graph is linear, you would not want to use polynomial fitting and get incorrect extrapolated results.

Actually it should be interpreted otherwise, 60% of the graph display a quasi linear rate of change of voltage vs frequency but power is the combination of those two factors, ie frequency x voltage^2, and the end result is non linear...

To get the power curve out of this one you should multiply the curve values by the voltages at each point, the result will be frequency x voltage x voltage, the Y axys will be referenced as the power in a relative scale unless you know an actual value to set an absolute scale..
 

beginner99

Diamond Member
Jun 2, 2009
5,210
1,580
136
More testing. This time I had all 4 threads referencing the same tree instance, which lead to some interesting results:

I tried to force less than optimal scenario by setting affinity to 0,2,8,10 and referencing same instance on all threads. Having one copy means that it can only reside in cache of one CCX at a time so with affinity set to run threads on both CCX we are bound to see increased latencies. Indeed quite frequently all threads have their latencies at around ~600-700ns. There is much more variation between runs compared to optimal scenario with two copies and affinity, where the latencies sit at around ~350ns on all threads. Though there is more variation with single copy, there is also consistency between the threads and their latencies tend to be within 20ns from one another.

So what about all 4 referencing same instance without affinity? Interesting enough results here are much the same as with 0,2,8,10 affinity. Similar latencies between ~600-700ns and similar consistency between threads.

Ok what about all 4 referencing same instance using one CCX with 0,2,4,6 affinity? Well just like you might expect, results are back to ~350ns on all threads given that again we have an optimal scenario with data residing in cache of same CCX as thread execution.

Last one I tested this time around was affinity of 0,1,2,3 meaning we stick to one CCX but only two physical cores. Once again consistent results with all threads at around ~450ns latency. Only some 100ns more than with 4 physical cores. SMT seems to be doing what it was built for here; context switching at blazing speeds :)

Thanks for this testing. Highly interesting. So it's confirmed that moving threads over CCX has a huge penalty and can alone explain issues for example in games as they have much more inter-thread communication than other multi-threaded benchmarks like encoding or rendering.
 

CataclysmZA

Junior Member
Mar 15, 2017
6
7
81
8Rch6JF.png

9oVGc83.png


Those two curves are contradictory, or at least they highlight the methodology used to draw the second one...

For the power increasing linearly with frequency like in the second curve between 600pts-840pts voltage should be kept constant....
This means that at 600pts the voltage is the same as at 840pts and power is hence overestimated.

Also there s no review that show 70W at 1400pts, FTR computerbase measure 76W delta at the main for CB R15 MT...

Look at the labels for the graphs again. "cTDP" is a configurable thermal envelope that can be adjusted in the BIOS, which is how Stilt managed to get these results more accurately than other sites just making voltage or frequency adjustments. The most I've seen others do is manage clock speeds by altering the power states in ASRock's boards. He's probably measuring straight off the chip itself in the first graph to get those voltage points as well.

Keep in mind as well that Pure Power can scale frequency up in 25MHz bins at the same power draw without increasing power draw until it becomes necessary. The first graph is just the minimum voltage required to hold that clock speed. The second graph is probably correct because SenseMI won't scale the voltage down too much with a 25W cTDP.
 

Ajay

Lifer
Jan 8, 2001
15,451
7,861
136
So I've read a good deal about possible problems with Windows 10 scheduler and how it may not be properly handling the two CCX design. Despite AMD already releasing a statement claiming there is no problem with scheduling under Windows, I decided to do a little experiment of my own and write a small benchmark in C++.

So this is what I did:

I have a hash table / tree structure which I populate with dictionary roughly the size of 3MB. I then create a copy of it and spawn 4 threads, each with reference to either of the copies. First two threads get reference to first one, and following two threads a reference to the copy. The threads will then proceed to fetch values by string keys. They each do this for 50k iterations and then report average time it took them to do it. For consistency they fetch by same hard coded keys, which are existing entries in the tree.

So in the end we have something like this:

.

Thank you for taking the time to do this!!

Would you mind posting the code for this? I think a several of us would find it to be helpful.
 

tamz_msc

Diamond Member
Jan 5, 2017
3,795
3,626
136
Actually it should be interpreted otherwise, 60% of the graph display a quasi linear rate of change of voltage vs frequency but power is the combination of those two factors, ie frequency x voltage^2, and the end result is non linear...

To get the power curve out of this one you should multiply the curve values by the voltages at each point, the result will be frequency x voltage x voltage, the Y axys will be referenced as the power in a relative scale unless you know an actual value to set an absolute scale..
That doesn't mean that you can explain away the graph of a straight line by fitting a polynomial.

Given the range of CB scores for the graph, comparing the score vs voltage and score vs frequency are equivalent, provided of course the scores scale linearly with frequency.

Edit: Also see the post above. Those are cTDP, not power consumed. Therefore multiplying that voltage-frequency curve with voltages at each point would lead to a completely different graph that makes the comparison with CB vs cTDP even more erroneous.
 
Last edited:

powerrush

Junior Member
Aug 18, 2016
20
4
41
I think must of the problems are related the CCX design, Haswell E or Broadwell E have a large L3 cache shared for all the cores. This ccx configuration is a Double CPU , the fabric clocks at the ram speed (2400mt=1200mhz) so we have to go at the speed of ram in order to communicate between CCX. Northbridge + hypertransport in Fx series had higher operative frequencies. To me is the CCX design and the low bandwidth of data fabric the issues.

walkthrough 1 optimize Windows scheduler, threads fixed at the core complex
walkthrough 2 optimize games and software to utilize better the two CCX

AMD can't switch the ccx architecture right now, what they can do is support better Ram frequencies in ZEN 2 in order to increase inter-CCX bandwidth.
 

powerrush

Junior Member
Aug 18, 2016
20
4
41
In this one i am speculating: it is possible for AMD adding a L4 cache shared across both CCX?? Or adding a link like Hypertransport independent of data fabric?
 

The Stilt

Golden Member
Dec 5, 2015
1,709
3,057
106
Plot this curve and tell us what is the rate of power vs frequency/voltage displayed here and how much more power is required at 3.2GHz in respect of 1.9GHz...

You will conclude that the rate of change is a polynomial of degree 2.56 in respect of frequency between 2.1 and 3.27GHz, and that the power at 3.2GHz is 3.33x the power at 1.9GHz, if the chip did actually require 35W at 1.9 then it would be over 110W at 3.2, and we know that it s within 65W at this frequency...

Physics and maths do not lie when they are understood correctly, and since the chip is at 65W at 3.2 then it means that it s at 20W at 1.9GHZ, and that the score is 850 at this power, and not at 35W.

You cannot compare the Vmin-Fmax curve with the Cinebench-cTDP curve.
In the Vmin-Fmax curve the voltage was manually set to the bare minimum value, which maintained the stability at the given frequency.
Meanwhile cTDP can only be used in "Normal-Mode", where the user has no true control over the voltages. Because of that the voltages for the Cinebench-cTDP chart were basically factory calibrated and because of that they weren't optimal , efficiency wise.
Since cTDP relies on the power limiters which are only active in "Normal Mode", using "OC-Mode" and configuring the voltages manually is not an option. It is naturally possible to add a negative voltage offset at the VRM controller, however it wouldn't improve the performance (clocks) despite it would result in lower voltage. The SMU calculates the power consumption based on the commanded voltage and external voltage offsets obviously cannot be seen by the SMU.

With few changes the performance would be significantly better, at the same power.
 
Last edited:

Abwx

Lifer
Apr 2, 2011
10,947
3,457
136
That doesn't mean that you can explain away the graph of a straight line by fitting a polynomial.

Excuse me but this is implicitely displayed and can be computed this way, say in the 2.1-3.3GHz range.

Frequency ratio is 33/21 = 1.57

Squared voltage ratio is (1010/710)^2 = 2.023

The product of those two values is the ratio of powers from 2.1 to 3.3GHz and is equal to 3.177.

Hence the degree of the polynomial is :

Ln(3.177)/Ln(1.57) = 2.56

Intel process has a value that is close to the theorical optimum of 2, so their power scaling is significantly better..

Given the range of CB scores for the graph, comparing the score vs voltage and score vs frequency are equivalent, provided of course the scores scale linearly with frequency.

CB scale linearly with frequency and core count, that s why despite being ICC compiled it s a very valuable bench to test a uarch evolution..


Edit: Also see the post above. Those are cTDP, not power consumed. Therefore multiplying that voltage-frequency curve with voltages at each point would lead to a completely different graph that makes the comparison with CB vs cTDP even more erroneous.

CTDP or not it is clear that the voltage at 1.9GHz is 0.875V, well above the displayed value of 710mV, that s the only way to make the chip draining 35W at 1.9GHz...
 

Abwx

Lifer
Apr 2, 2011
10,947
3,457
136
In the Vmin-Fmax curve the voltage was manually set to the bare minimum value, which maintained the stability at the given frequency.

The chip require 0.875V@3GHz under Cinebench, this has been tested by BC, while your curve display 930mV at this frequency, obviously this latter value is above Fmin.

C6hGF7bWgAAmpVG.jpg

Because of that the voltages for the Cinebench-cTDP chart were basically factory calibrated and because of that they weren't optimal , efficiency wise.
Since cTDP relies on the power limiters which are only active in "Normal Mode", using "OC-Mode" and configuring the voltages manually is not an option. It is naturally possible to add a negative voltage offset at the VRM controller, however it wouldn't improve the performance (clocks) despite it would result in lower voltage. The SMU calculates the power consumption based on the commanded voltage and external voltage offsets obviously cannot be seen by the SMU.

With few changes the performance would be significantly better, at the same power.

This i can agree with, we ll see if someone can do the test at the relevant voltages but in principle it should be at about 25W at 850pts and at 1000pts for barely 35W.
 
Status
Not open for further replies.