- Jul 28, 2019
- 470
- 230
- 76
Added cores:


TOP 10 - Performance Per Area comparison at ISO-clock (PPA/GHz)
Copied from locked thread. They try to avoid people to see this comparison how x86 is so bad.[/B]
It's impressive how fast are evolving the generic Cortex cores:
Comparison how x86 vs. Cortex cores:
Comparison to Apple cores:
GeekBench5.1 comparison from 6/22/2020:
EDIT:
Please note to stop endless discussion about PPC frequency scaling: To have fair and clean comparison I will use only the top (high clocked) version from each core as representation for top performance.
- A53 - little core used in some low-end smartphones in 8-core config (Snapdragon 450)
- A55 - used as little core in every modern Android SoC
- A72 - "high" end Cortex core used in Snapdragon 625 or Raspberry Pi 4
- A73 - "high" end Cortex core
- A75 - "high" end Cortex core
- Bulldozer - infamous AMD core
Pos | Man | CPU | Core | Year | ISA | GB5 Score | GHz | PPC (score/GHz) | Relative to 9900K | Relative to Zen3 |
1 | Nuvia | (Est.) | Phoenix (Est.) | 2021 | ARMv9.0 | 2001 | 3.00 | 667.00 | 241.0% | 194.1% |
2 | Apple | A15 (est.) | (Est.) | 2021 | ARMv9.0 | 1925 | 3.00 | 641.70 | 231.8% | 186.8% |
3 | Apple | A14 (est.) | Firestorm | 2020 | ARMv8.6 | 1562 | 2.80 | 558.00 | 201.6% | 162.4% |
4 | Apple | A13 | Lightning | 2019 | ARMv8.4 | 1332 | 2.65 | 502.64 | 181.6% | 146.3% |
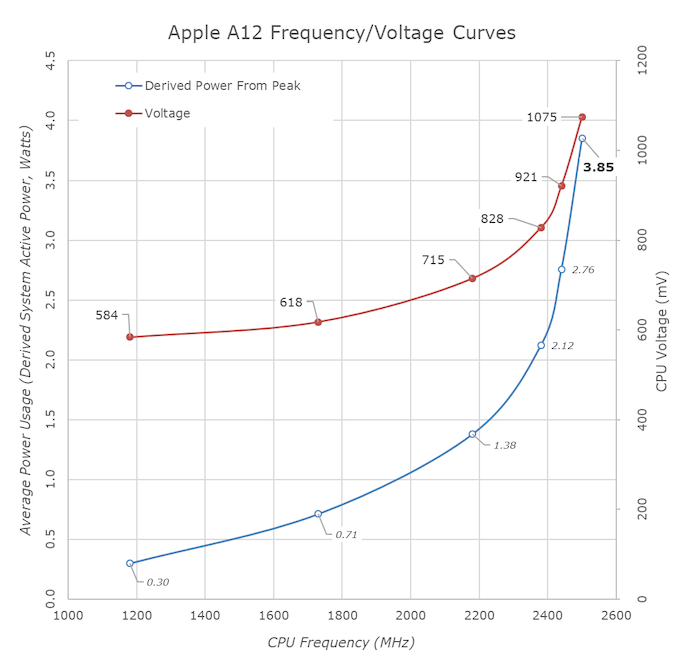
5 | Apple | A12 | Vortex | 2018 | ARMv8.3 | 1116 | 2.53 | 441.11 | 159.4% | 128.4% |
6 | ARM Cortex | V1 (est.) | Zeus | 2020 | ARMv8.6 | 1287 | 3.00 | 428.87 | 154.9% | 124.8% |
7 | ARM Cortex | N2 (est.) | Perseus | 2021 | ARMv9.0 | 1201 | 3.00 | 400.28 | 144.6% | 116.5% |
8 | Apple | A11 | Monsoon | 2017 | ARMv8.2 | 933 | 2.39 | 390.38 | 141.0% | 113.6% |
9 | Intel | (Est.) | Golden Cove (Est.) | 2021 | x86-64 | 1780 | 4.60 | 386.98 | 139.8% | 112.6% |
10 | ARM Cortex | X1 | Hera | 2020 | ARMv8.2 | 1115 | 3.00 | 371.69 | 134.3% | 108.2% |
11 | AMD | 5900X (Est.) | Zen 3 (Est.) | 2020 | x86-64 | 1683 | 4.90 | 343.57 | 124.1% | 100.0% |
12 | Apple | A10 | Hurricane | 2016 | ARMv8.1 | 770 | 2.34 | 329.06 | 118.9% | 95.8% |
13 | Intel | 1065G7 | Icelake | 2019 | x86-64 | 1252 | 3.90 | 321.03 | 116.0% | 93.4% |
14 | ARM Cortex | A78 | Hercules | 2020 | ARMv8.2 | 918 | 3.00 | 305.93 | 110.5% | 89.0% |
15 | Apple | A9 | Twister | 2015 | ARMv8.0 | 564 | 1.85 | 304.86 | 110.1% | 88.7% |
16 | AMD | 3950X | Zen 2 | 2019 | x86-64 | 1317 | 4.60 | 286.30 | 103.4% | 83.3% |
17 | ARM Cortex | A77 | Deimos | 2019 | ARMv8.2 | 812 | 2.84 | 285.92 | 103.3% | 83.2% |
18 | Intel | 9900K | Coffee LakeR | 2018 | x86-64 | 1384 | 5.00 | 276.80 | 100.0% | 80.6% |
19 | Intel | 10900K | Comet Lake | 2020 | x86-64 | 1465 | 5.30 | 276.42 | 99.9% | 80.5% |
20 | Intel | 6700K | Skylake | 2015 | x86-64 | 1032 | 4.00 | 258.00 | 93.2% | 75.1% |
21 | ARM Cortex | A76 | Enyo | 2018 | ARMv8.2 | 720 | 2.84 | 253.52 | 91.6% | 73.8% |
22 | Intel | 4770K | Haswell | 2013 | x86-64 | 966 | 3.90 | 247.69 | 89.5% | 72.1% |
23 | AMD | 1800X | Zen 1 | 2017 | x86-64 | 935 | 3.90 | 239.74 | 86.6% | 69.8% |
24 | Apple | A13 | Thunder | 2019 | ARMv8.4 | 400 | 1.73 | 231.25 | 83.5% | 67.3% |
25 | Apple | A8 | Typhoon | 2014 | ARMv8.0 | 323 | 1.40 | 230.71 | 83.4% | 67.2% |
26 | Intel | 3770K | Ivy Bridge | 2012 | x86-64 | 764 | 3.50 | 218.29 | 78.9% | 63.5% |
27 | Apple | A7 | Cyclone | 2013 | ARMv8.0 | 270 | 1.30 | 207.69 | 75.0% | 60.5% |
28 | Intel | 2700K | Sandy Bridge | 2011 | x86-64 | 723 | 3.50 | 206.57 | 74.6% | 60.1% |
29 | ARM Cortex | A75 | Prometheus | 2017 | ARMv8.2 | 505 | 2.80 | 180.36 | 65.2% | 52.5% |
30 | ARM Cortex | A73 | Artemis | 2016 | ARMv8.0 | 380 | 2.45 | 155.10 | 56.0% | 45.1% |
31 | ARM Cortex | A72 | Maya | 2015 | ARMv8.0 | 259 | 1.80 | 143.89 | 52.0% | 41.9% |
32 | Intel | E6600 | Core2 | 2006 | x86-64 | 338 | 2.40 | 140.83 | 50.9% | 41.0% |
33 | AMD | FX-8350 | BD | 2011 | x86-64 | 566 | 4.20 | 134.76 | 48.7% | 39.2% |
34 | AMD | Phenom 965 BE | K10.5 | 2006 | x86-64 | 496 | 3.70 | 134.05 | 48.4% | 39.0% |
35 | ARM Cortex | A57 (est.) | Atlas | 0 | ARMv8.0 | 222 | 1.80 | 123.33 | 44.6% | 35.9% |
36 | ARM Cortex | A15 (est.) | Eagle | 0 | ARMv7 32-bit | 188 | 1.80 | 104.65 | 37.8% | 30.5% |
37 | AMD | Athlon 64 X2 3800+ | K8 | 2005 | x86-64 | 207 | 2.00 | 103.50 | 37.4% | 30.1% |
38 | ARM Cortex | A17 (est.) | | 0 | ARMv7 32-bit | 182 | 1.80 | 100.91 | 36.5% | 29.4% |
39 | ARM Cortex | A55 | Ananke | 2017 | ARMv8.2 | 155 | 1.60 | 96.88 | 35.0% | 28.2% |
40 | ARM Cortex | A53 | Apollo | 2012 | ARMv8.0 | 148 | 1.80 | 82.22 | 29.7% | 23.9% |
41 | Intel | Pentium D | P4 | 2005 | x86-64 | 228 | 3.40 | 67.06 | 24.2% | 19.5% |
42 | ARM Cortex | A7 (est.) | Kingfisher | 0 | ARMv7 32-bit | 101 | 1.80 | 56.06 | 20.3% | 16.3% |
TOP 10 - Performance Per Area comparison at ISO-clock (PPA/GHz)
Copied from locked thread. They try to avoid people to see this comparison how x86 is so bad.[/B]
Pos | Man | CPU | Core | Core Area mm2 | Year | ISA | SPEC PPA/Ghz | Relative |
1 | ARM Cortex | A78 | Hercules | 1.33 | 2020 | ARMv8 | 9.41 | 100.0% |
2 | ARM Cortex | A77 | Deimos | 1.40 | 2019 | ARMv8 | 8.36 | 88.8% |
3 | ARM Cortex | A76 | Enyo | 1.20 | 2018 | ARMv8 | 7.82 | 83.1% |
4 | ARM Cortex | X1 | Hera | 2.11 | 2020 | ARMv8 | 7.24 | 76.9% |
5 | Apple | A12 | Vortex | 4.03 | 2018 | ARMv8 | 4.44 | 47.2% |
6 | Apple | A13 | Lightning | 4.53 | 2019 | ARMv8 | 4.40 | 46.7% |
7 | AMD | 3950X | Zen 2 | 3.60 | 2019 | x86-64 | 3.02 | 32.1% |
It's impressive how fast are evolving the generic Cortex cores:
- A72 (2015) which can be found in most SBC has 1/3 of IPC of new Cortex X1 - They trippled IPC in just 5 years.
- A73 and A75 (2017) which is inside majority of Android smart phones today has 1/2 IPC of new Cortex X1 - They doubled IPC in 3 years.
Comparison how x86 vs. Cortex cores:
- A75 (2017) compared to Zen1 (2017) is loosing massive -34% PPC to x86. As expected.
- A77 (2019) compared to Zen2 (2018) closed the gap and is equal in PPC. Surprising. Cortex cores caught x86 cores.
- X1 (2020) is another +30% IPC over A77. Zen3 need to bring 30% IPC jump to stay on par with X1.
Comparison to Apple cores:
- AMD's Zen2 core is slower than Apple's A9 from 2015.... so AMD is 4 years behind Apple
- Intel's Sunny Cove core in Ice Lake is slower than Apple's A10 from 2016... so Intel is 3 years behind Apple
- Cortex A77 core is slower than Apple's A9 from 2015.... but
- New Cortex X1 core is slower than Apple's A11 from 2017 so ARM LLC is 3 years behind Apple and getting closer
GeekBench5.1 comparison from 6/22/2020:
- added Cortex X1 and A78 performance projections from Andrei here
- 2020 awaiting new Apple A14 Firestorm core and Zen3 core
EDIT:
Please note to stop endless discussion about PPC frequency scaling: To have fair and clean comparison I will use only the top (high clocked) version from each core as representation for top performance.
Last edited: