Ryzen: Strictly technical

Page 41 - Seeking answers? Join the AnandTech community: where nearly half-a-million members share solutions and discuss the latest tech.
Status
Not open for further replies.

looncraz

Senior member
Sep 12, 2011
722
1,651
136
I really think they should have made a 1400X with the 1500X clocks(4/8 @ 3.5~3.7: $189)
and had the 1500X be the true scaled down 1800X gamer quad @3.6~4.0: $209 or so

Wouldn't be enough of a distinction. AMD seems to simply be ignoring the 2+2 vs 4+0 configuration aside from the cache size. Larger cache sales... trying to explain 2+2 vs 4+0 to a layman isn't going to get you very far... and, for some very strange reason, AMD thinks the layman will look at CPU specs when buying a computer.
 

tamz_msc

Diamond Member
Jan 5, 2017
3,770
3,590
136
I don't know if this has been posted before, but 2+2 seems to take the least hit in the sequential L3 benchmarking of Hardware.fr:
getgraphimg.php


This makes the 1500X vs 1400 case even more interesting.
 

looncraz

Senior member
Sep 12, 2011
722
1,651
136
I don't know if this has been posted before, but 2+2 seems to take the least hit in the sequential L3 benchmarking of Hardware.fr:
getgraphimg.php


This makes the 1500X vs 1400 case even more interesting.

This would only make sense if AMD had planned in a different L3 eviction and search policies for the 2+2 configuration... which is a logical course to take. Doesn't change the fact that 4+0 is still better for performance consistency as you don't have the ~100ns inter-CCX latency penalty.

If anyone was wondering, 13ns at 3Ghz is ~40 cycles (technically 39, but I'm betting the 13ns is rounded :p).
 

Rngwn

Member
Dec 17, 2015
143
24
36
I don't know if this has been posted before, but 2+2 seems to take the least hit in the sequential L3 benchmarking of Hardware.fr:
getgraphimg.php


This makes the 1500X vs 1400 case even more interesting.

Don't forget that the 2+2 still has 8MB cache per CCX which means that the cross-CCX communication may hot have fully kicked in yet. JM2c
 

tamz_msc

Diamond Member
Jan 5, 2017
3,770
3,590
136
This would only make sense if AMD had planned in a different L3 eviction and search policies for the 2+2 configuration... which is a logical course to take. Doesn't change the fact that 4+0 is still better for performance consistency as you don't have the ~100ns inter-CCX latency penalty.

If anyone was wondering, 13ns at 3Ghz is ~40 cycles (technically 39, but I'm betting the 13ns is rounded :p).
Yeah those values are indeed rounded. Just compare the same graphs on the previous page.
 

Dresdenboy

Golden Member
Jul 28, 2003
1,730
554
136
citavia.blog.de
This would only make sense if AMD had planned in a different L3 eviction and search policies for the 2+2 configuration... which is a logical course to take. Doesn't change the fact that 4+0 is still better for performance consistency as you don't have the ~100ns inter-CCX latency penalty.

If anyone was wondering, 13ns at 3Ghz is ~40 cycles (technically 39, but I'm betting the 13ns is rounded :p).
Are these sizes at hardware.fr per core?

2+2 could be that fast due to that.
 
  • Like
Reactions: powerrush

Dresdenboy

Golden Member
Jul 28, 2003
1,730
554
136
citavia.blog.de
All the problem with Ryzen is that "coherent" data fabric. It runs at half the ram speed.
We haven't fully identified the root causes in most relevant scenarios. The IMC has high latency regardless the DF. SMT uses some statically partitioned buffers, etc.

Intel has closely located ring bus stops. DF mesh endpoints might be farther away from eachother, limiting possible clocks, but providing easier scalability.
 

oegat

Junior Member
Mar 19, 2017
2
30
41
TL;DR: a 10% performance hit in single-threaded performance under Windows 8.1 on a Magny-Cours 2-module CPU is found when three factors are allowed to coincide: thread migration across modules is allowed, the OS timer is at a high resolution, and core parking is allowed.

I joined just to share a test result of mine, which might interest some in this discussion. I ran tests on a virtual Windows 8.1 instance with 8 virtual processors, all pinned 1-1 to the 8 cores on a single Opteron 6140 (Magny-cours) die. The reason for the test, and why I bring it up in this thread, is that Magny-cours has a couple of key similarities with Ryzen when it comes to CPU topology:

  • Each Magny-cours die consists of two ”modules” which share 4-6 (4 on the 6140) cores and an L3 cache
  • L1+2 are private per core, L3 is shared per module and is a victim-cache of L2

Thus, the invisible (to Windows) module boundary that exists between the CCX of a Ryzen chip is also present in Magny-Cours, and the cache works similarly. I reasoned that if the performance differences we see for some loads between 2CCX vs 1CCX on Ryzen are really related to issues with inter-CCX communication or the fact that the L3 is a victim cache, the same phenomenon should be replicable on Magny-Cours. If, on the other hand, performance issues has to do with some other idiosyncracy with Ryzen which we have not yet quantified, Magny-Cours should not be affected. Additionally, I considered the following factors:

  • OS timer setting – AMD has mentioned that Win10’s habit of setting a high (~1ms) OS timer freq for games might hamper performance. As Win7 typically runs everything on the default timer setting (15.625ms), this could explain the small but stable performance delta for some loads between Win7 and Win10, which remains regardless of SMT.
  • Power plan – thanks to Kromaatikse’s investigations, we know that scheduling issues on Ryzen interacts with or are driven by power settings, presumably core parking.
  • Topology visible to OS – thanks to KVM/libvirt, I can present the Magny-cours die either as one processor with 8 cores, or as two processors on two sockets with 4 cores each, the latter implicitly telling Windows which cores are sharing L3 and go together.

In order to sort out how these factors together impact performance Magny-cours, I combined them in a factorial experiment with 8 conditions, described below, with performance in the syntetic Wprime benchmark as the dependent measure.

Test bed:
  • Supermicro H8DG6, 2x Opteron 6140 (8x2.6GHz per CPU), 32Gb ram
  • Ubuntu 16.10 4.4.0-64 generic (VMhost), Windows 8.1 (VM guest)
  • ”Node interleaving” enabled in BIOS settings (NUMA topology flattened out and hidden from OS, in order to mimick Ryzen as closely as possible).
  • All 8 cores on the second CPU MCM are dedicated to Windows (1-1 pinning, removed from linux scheduler with isolcpus)
Windows 8.1 sees: 8x Magny-Cours cores (host-passthrough), topology according to the two conditions described above, 14Gb ram

Experiment 1.
Factorial structure:
OS timer {15.625ms | .05ms} * Power setting {Balanced | High performance} * libvirt CPU topology {sockets=1,cores=8,threads=1 | sockets=2,cores=4,threads=1}, yielding 8 conditions

Dependent variable: Wprime single-threaded 32M test running time (shorter is better)

OS timer is set with the program TimerTool, power plan is set and monitored with ParkControl, and CPU topology is set by the libvirt <topology=...> XML tag in the VM config file.

Here are the results. I ran three tests in each condition in order to quantify variability, the median of each condition is highlighted in the table given by the middle rows. The % column is the penalty of running the OS timer at 0.5ms rather than 15.265ms.
Code:
             sockets=2,cores=4,threads=1        sockets=1,cores=8,threads=1
             (aware of modularity)		(unaware of modularity)		

             15.625ms   0.5ms	%penalty	15.625ms 0.5ms	%penalty
hi perf      66.36	66.38	 0%		64.35	 64.9	 1%
             66.84	66.67	 0%		64.74	 65.35	 1%
	     67.4	66.9	-1%		65.57	 65.89	 1%
balanced     68.83	69.01	 0%		66.08	 73.58	 11%
             69	        69.03	 0%		66.11	 73.81	 12%
	     69.87	69.45	-1%		66.13	 74.59   13%

(sorry for the hacky display, I tried to do bbcode tables but they seem unsupported).

We see that only when all factors combine together in a specific way a substantial performance regression due to the OS timer (~12%) can be seen. Interestingly, making Windows aware of the dual-module structure of the physical processor die removes the regression, perhaps through scheduling differences. Perhaps less surprisingly, the regression disappears almost entirely in high performance power mode (regardless of CPU topology). This suggests that it is the unparking of cores that is responsible for the regression, rather than overhead due to starting over with a cold cache on a new 4core-module (at least for this load).

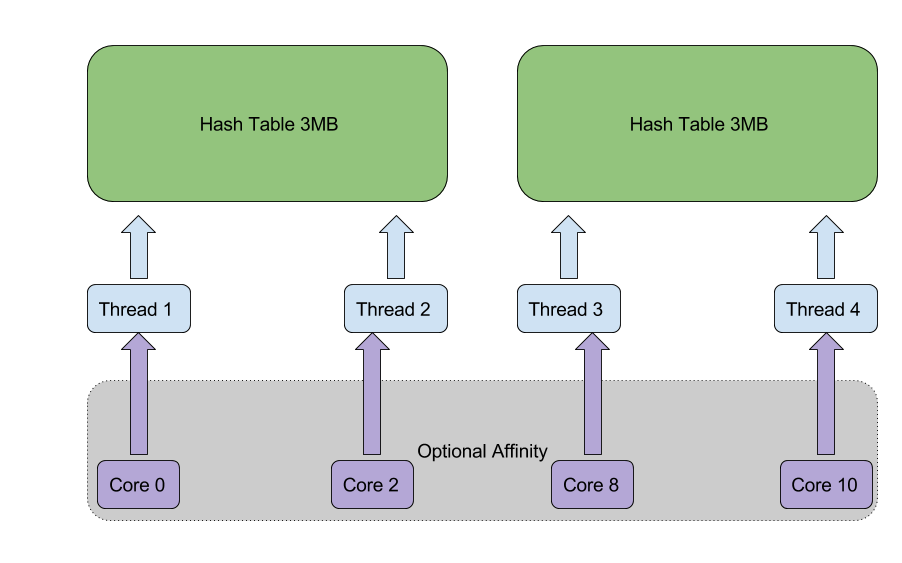
Then I ran a second experiment just to verify that the beneficial effect of making windows aware of the topology actually reflects more optimised scheduling, rather than some other aspect which we have not measured. This was achieved through letting Windows see only one socket with 8 cores, but setting CPU affinity of the worker thread manually to a single CPU core (setting affinity to all 4 cores of one module would have been a cleaner condition, but I realised that half-way through testing).

Experiment 2.
Factorial structure: OS-timer {15.625ms | 0.5ms} x Thread Affinity {TA set | TA not set}
Factors from exp1 held constant: topology=1socket,8cores,1threads, powerplan=”Balanced”
Dependent variable: Wprime single-threaded 1024M test running time (shorter is better)
Code:
                        sockets=1,cores=8,threads=1
                        (unaware of modularity)

	                15.625ms     0.5ms	%penalty
balanced, TA not set	2168.88	     2394.9	 10%
balanced, TA set	2061.27	     2068.93	 0%

I chose the longer Wprime test in order to increase the SNR, as I set affinity manually in each run (within the first 15s of the total 33-35 minute running time). As we see, setting the thread affinity of the process also removes the regression incurred by a higher OS timer resolution. So the effect of topology indeed seems to reflect whether threads are scheduled across modules or not. This is actually quite reasonable, as multi-socket multi-core systems where around before the introduction of NUMA, and Windows versions since NT should know what to do with such a system. CPU cores sharing a socket on a non-NUMA system would typically share a private LLC without sharing a private memory controller, why a dual-socket spoof would be better than a NUMA-spoof in order to make Windows aware of Ryzen/Magny-cours modularity. It remains to show, however, whether Windows’ default behaviour in such a case is optimal for Ryzen.

The OS timer seems the most important factor in this test. This could explain the win7-win10 performance deltas seen in some games, as win10 reportedly increases the timer resolution in games, and also shows lower game performance (also after SMT has been turned off) – this correlational hypothesis remains to be tested on Ryzen, suggestedly by overriding the OS timer setting. The timer aspect might amplify several other factors having to do with power state changes and maladaptive scheduling decisions – at higher timer resolution, whatever mischief Windows is doing it will do more often. Indeed, higher OS timer resolution should always lead to some more overhead (we see that on Linux too), but 10-12% is clearly over the top.

The evidence that the power plan is crucial for whether the performance regression appears is consistent with Kromaatsike’s theory on core parking adversely interacting with thread scheduling. This is also consistent with AMD’s current focus on power management settings rather than the Windows scheduler. This part is probably not surprising for readers of this thread, though I am still at loss on what exactly is happening with power management here. It should be emphasised, however, that the problem only appears if the scheduler is allowed to schedule across the Magny-Cours module boundary, so the modularity of the processor die does matter (so it should for Ryzen).

The bottom line
Why I think this experiment is interesting is that the hypotheses I test were all generated from looking at evidence and theory regarding Ryzen’s performance, and the hypothesis that these three aspects may interact was originally formulated for Ryzen. The evidence that Magny-Cours behaves as I expect Ryzen to behave indicates that we are indeed on the right track regarding suspecting the dual-CCX design and the victim design of the L3, rather than any other so far unmeasured idiosyncracy of Ryzen.

It would thus be interesting to see all or parts of this experiment replicated on Ryzen under Windows 8 or 10. Allegedly, there are relevant differences between Ryzen and Magny-Cours, for example the communication protocol between modules (direct HyperT links vs IF bus) and the presence of an L3 snoop-filter in Magny-Cours. I expect these differences to load on the magnitude of the effects, rather than on their presence. A final replication which I would like to see is on a dual-socket multi-core Intel system with ”node interleaving” enabled, in which a Windows VM gets a set of cores originating from two different physical processors. This would tell whether the phenomenon discussed here is ultimately an AMD issue or a basic architectural and/or Windows issue.
 

icelight_

Junior Member
Mar 19, 2017
5
1
51
We haven't fully identified the root causes in most relevant scenarios. The IMC has high latency regardless the DF. SMT uses some statically partitioned buffers, etc.

Intel has closely located ring bus stops. DF mesh endpoints might be farther away from eachother, limiting possible clocks, but providing easier scalability.
Intel also uses statically partitioned buffers according to the Intel 64 and IA-32 Architectures Optimization Reference Manual chapter 2.6.1. AMD actually shares more than Intel, namely the load queue and the ITLB.
 
  • Like
Reactions: Dresdenboy

innociv

Member
Jun 7, 2011
54
20
76
Why do folks complain about this, it's pretty much the default way to go about it as it scales with memory BW needs. Running it faster to reduce latency can be an upside but is less efficient.
Because it'd make more sense to run at double memory speed since it's not double data rate, wouldn't it?
 

ryzenmaster

Member
Mar 19, 2017
40
89
61
So I've read a good deal about possible problems with Windows 10 scheduler and how it may not be properly handling the two CCX design. Despite AMD already releasing a statement claiming there is no problem with scheduling under Windows, I decided to do a little experiment of my own and write a small benchmark in C++.

So this is what I did:

I have a hash table / tree structure which I populate with dictionary roughly the size of 3MB. I then create a copy of it and spawn 4 threads, each with reference to either of the copies. First two threads get reference to first one, and following two threads a reference to the copy. The threads will then proceed to fetch values by string keys. They each do this for 50k iterations and then report average time it took them to do it. For consistency they fetch by same hard coded keys, which are existing entries in the tree.

So in the end we have something like this:

ryzenbench.png


Now the theory here is that should there be no issues with scheduling, we should see fairly small deviation in latencies between the threads. Ideally Windows scheduler would keep all of those 4 threads to single CCX for fast and consistent cache access. To test this I ran it a dozen times with and without affinity.

When I tested with affinity of 0,2,8,10 I was able to get quite consistent results with a typical run reporting something like:

[Thread: 1] Avg: 403ns
[Thread: 2] Avg: 413ns
[Thread: 3] Avg: 337ns
[Thread: 4] Avg: 386ns

An affinity of 0,2,4,6 produced similar results in a consistent manner. Now the fun part is when I ran it without affinity.. latencies were all over the place without any consistency between the runs. Sometimes I got similar results to running with affinity and sometimes I would see something like this:

[Thread: 1] Avg: 1034ns
[Thread: 2] Avg: 1039ns
[Thread: 3] Avg: 343ns
[Thread: 4] Avg: 383ns

I will be doing more test runs later and will also be trying out different affinity masks to see how it affects results. I'd also hope to try this on Linux, but currently I only have Windows 10 installed, so we'll see when I get enough time. In conclusion it is too early to definitively make any statements as to whether and why there are issues in scheduling on Windows.. I would still say it is rather interesting how much more consistent and lower latency runs I'm getting when the application is setting thread affinity rather than leaving it up to OS scheduler.
 

Abwx

Lifer
Apr 2, 2011
10,937
3,439
136
8Rch6JF.png

9oVGc83.png


Those two curves are contradictory, or at least they highlight the methodology used to draw the second one...

For the power increasing linearly with frequency like in the second curve between 600pts-840pts voltage should be kept constant....
This means that at 600pts the voltage is the same as at 840pts and power is hence overestimated.

Also there s no review that show 70W at 1400pts, FTR computerbase measure 76W delta at the main for CB R15 MT...
 

looncraz

Senior member
Sep 12, 2011
722
1,651
136
8Rch6JF.png

9oVGc83.png


Those two curves are contradictory, or at least they highlight the methodology used to draw the second one...

For the power increasing linearly with frequency like in the second curve between 600pts-840pts voltage should be kept constant....
This means that at 600pts the voltage is the same as at 840pts and power is hence overestimated.

Also there s no review that show 70W at 1400pts, FTR computerbase measure 76W delta at the main for CB R15 MT...

Power draw (wattage) increases exponentially beyond a certain point.

Going from 2100 to 3300 MHz is a 65% increase in frequency.

Going from ~600 to ~1000 is a 65% increase in performance.

So the charts are in agreement.

It's just that once you hit that first critical voltage power draw increases dramatically.
 

oegat

Junior Member
Mar 19, 2017
2
30
41
So I've read a good deal about possible problems with Windows 10 scheduler and how it may not be properly handling the two CCX design. Despite AMD already releasing a statement claiming there is no problem with scheduling under Windows, I decided to do a little experiment of my own and write a small benchmark in C++.

So this is what I did:

I have a hash table / tree structure which I populate with dictionary roughly the size of 3MB. I then create a copy of it and spawn 4 threads, each with reference to either of the copies. First two threads get reference to first one, and following two threads a reference to the copy. The threads will then proceed to fetch values by string keys. They each do this for 50k iterations and then report average time it took them to do it. For consistency they fetch by same hard coded keys, which are existing entries in the tree.

So in the end we have something like this:

ryzenbench.png


Now the theory here is that should there be no issues with scheduling, we should see fairly small deviation in latencies between the threads. Ideally Windows scheduler would keep all of those 4 threads to single CCX for fast and consistent cache access. To test this I ran it a dozen times with and without affinity.

When I tested with affinity of 0,2,8,10 I was able to get quite consistent results with a typical run reporting something like:

[Thread: 1] Avg: 403ns
[Thread: 2] Avg: 413ns
[Thread: 3] Avg: 337ns
[Thread: 4] Avg: 386ns

An affinity of 0,2,4,6 produced similar results in a consistent manner. Now the fun part is when I ran it without affinity.. latencies were all over the place without any consistency between the runs. Sometimes I got similar results to running with affinity and sometimes I would see something like this:

[Thread: 1] Avg: 1034ns
[Thread: 2] Avg: 1039ns
[Thread: 3] Avg: 343ns
[Thread: 4] Avg: 383ns

I will be doing more test runs later and will also be trying out different affinity masks to see how it affects results. I'd also hope to try this on Linux, but currently I only have Windows 10 installed, so we'll see when I get enough time. In conclusion it is too early to definitively make any statements as to whether and why there are issues in scheduling on Windows.. I would still say it is rather interesting how much more consistent and lower latency runs I'm getting when the application is setting thread affinity rather than leaving it up to OS scheduler.

Interesting! Was this result (erratic behaviour when thread affinity were not set) obtained with core parking enabled or disabled? If enabled, it would be interesting to see if the inconsistencies in results without affinity disappear if core parking is disabled. High performance power plan should typically disable core parking.
 

ryzenmaster

Member
Mar 19, 2017
40
89
61
Interesting! Was this result (erratic behaviour when thread affinity were not set) obtained with core parking enabled or disabled? If enabled, it would be interesting to see if the inconsistencies in results without affinity disappear if core parking is disabled. High performance power plan should typically disable core parking.

My setup is following:

OS Name: Microsoft Windows 10 Pro
OS Version: 10.0.14393 N/A Build 14393

Ryzen R7 1700 @ 3.7GHz

Core parking has been explicitly disabled and power plan is set to high performance just in case.
 

dnavas

Senior member
Feb 25, 2017
355
190
116
Now the fun part is when I ran it without affinity.. latencies were all over the place without any consistency between the runs. Sometimes I got similar results to running with affinity and sometimes I would see something like this:

[Thread: 1] Avg: 1034ns
[Thread: 2] Avg: 1039ns
[Thread: 3] Avg: 343ns
[Thread: 4] Avg: 383ns

I'd try running with one core free for Windows to run its random stuff in.
 

Abwx

Lifer
Apr 2, 2011
10,937
3,439
136
So the charts are in agreement.

They are not, obviously....

Power draw (wattage) increases exponentially beyond a certain point.

That s a general statement that has nothing to do with the curves displayed, the rate is explicit in the voltage/frequency curve and is a polynomial of degree 2.56 up to 3GHz or so at wich inflexion point it abruptly transit to 3 and then to 4.

Besides from 600pts to 840pts the curve is a straight line while it should be a quasi paraboloïd, this is an indication that the voltage at 600pts is the same as at 840pts, actually the chip should score 1000pts at 30W.

Edit : If it required 35W@850pts then it would require 125W to score 1400pts like the R7 1700, so the number from The Stilt is obviously completely wrong..
 
Last edited:

CuriousMike

Diamond Member
Feb 22, 2001
3,044
543
136
Does anyone have a good suggestion for where to learn about Windows 10 core parking?
As I'm doing a modest LR photo export, I notice that a random number of cores are parked at any given time during the export-- ranging from 8 cores to no cores parked.
ryzen_lr_export.jpg

ryzen_lr_export_2.jpg
 

imported_jjj

Senior member
Feb 14, 2009
660
430
136
They are not, obviously....


That s a general statement that has nothing to do with the curves displayed, the rate is explicit in the voltage/frequency curve and is a polynomial of degree 2.56 up to 3GHz or so at wich inflexion point it abruptly transit to 3 and then to 4.

Besides from 600pts to 840pts the curve is a straight line while it should be a quasi paraboloïd, this is an indication that the voltage at 600pts is the same as at 840pts, actually the chip should score 1000pts at 30W.

Edit : If it required 35W@850pts then it would require 125W to score 1400pts like the R7 1700, so the number from The Stilt is obviously completely wrong..

The voltages could be flatish as the clocks are bellow the range shown in the first graph.
You do seem to be confusing the cores and the SoC while also assuming that CB scales perfectly with clocks.
As for Computerbase and 76W delta at the main, the review here does a bit better than that. "All of the power consumption measurements have been made with DCR method. The figures represent the total combined power consumed by the CPU cores (VDDCR_CPU, Plane 1) and the data fabric / the peripherals (VDDCR_SOC, Plane 2). These figures do not include switching or conduction losses."
 

Rngwn

Member
Dec 17, 2015
143
24
36
Mem clock * 32 bytes in each direction. E.g. 38.4GB/s with DDR4 @ 2400MHz. Looncraz made a list a few pages ago.

That reminds me of the commotion about ryzen's DF being "half the memory clock". The "2400 MHz" is actually a misnomer and should have been read as "2400 MT/s" and the RAM itself would actually be operating at 1200 MHz. Unless the ryzen's DF is actually operating at 600 MHz, we could put to rest about the "half frequency" stuffs.
 
Status
Not open for further replies.