Ryzen: Strictly technical

Page 20 - Seeking answers? Join the AnandTech community: where nearly half-a-million members share solutions and discuss the latest tech.
Status
Not open for further replies.

piesquared

Golden Member
Oct 16, 2006
1,651
473
136
You must be referring to the power testing hardware we used to elaborate on the RX480 power draw issues. Not only did AMD acknowledge the information we provided, they (mostly) fixed the issue. I wasn't joking, and neither were they.
I also busted out an o-scope to show differences between G-Sync and FreeSync, which not only educated folks, it likely pushed AMD to implement of Low Framerate Compensation.
Yes, I'm an electronics geek. I try to use my skill set to help the community by pushing manufacturers to improve their products.


Thanks. We still need to test on Intel quad core CPUs - they should have lower core-to-core latency as they aren't dealing with the larger ring bus. I used 5960X as the comparison point so we had matching core counts.

Allyn


I'm referring to all the 'special' test PCPer busts out on an AMD launch, yet has to be dragged tooth and nail to even acknowledge issue like the 4GB/3.5GB memory issue with the 970.

But since you are in the mood for investigating, i wonder if you could set up your 4 core test to replicate this scenario and show the results. I'd like to know where the choke points are on a 4 core system. Is there anything positive you can investigate on Ryzen, or are you only interested in exploiting a single lower than expected result (which is being rectified with developers)-gaming?
Anyway, Jayz2Cents seems quite surprised at the results here, like it is something he hasn't experienced before, which points to advantages with 8 cores. Any chance of some time spent on this?

@10:36

https://youtu.be/8-mMBbWHrwM?t=636
 

Dygaza

Member
Oct 16, 2015
176
34
101
Is there a risk , that when thread gets bounced from one CCX to another, that the L2 and L3 of another CCX will be used instead of local ones?
 

DisEnchantment

Golden Member
Mar 3, 2017
1,590
5,722
136

The C++ apps are incredibly simple and are only creating threads or pinging between cores. If such a simple app must be rewritten with workarounds just for AMD processors, we have a serious problem.

Is there a risk , that when thread gets bounced from one CCX to another, that the L2 and L3 of another CCX will be used instead of local ones?

Imagine your process having some static or local data and you create some worker threads and they access this data...
What if this child thread is scheduled on another core or CCX? A simple variable read by a thread of this data would incur huge penalty simply because the data is not in the cache and has to be fetched stalling throughput.
Data Localization.
 
Last edited:

lolfail9001

Golden Member
Sep 9, 2016
1,056
353
96
What if this child thread is scheduled on another core or CCX? A simple variable read by a thread of this data would incur huge penalty simply because the data is not in the cache and has to be fetched stalling throughput.
That applies to every other CPU as well. Looks like the benefit of CPU getting to work straight away (while getting shuffled) counteracts the cold cache from Windows perspective. Alternatively, you could try to run every relevant weakly threaded app on highest or even real-time priority and compare performance.
 

virpz

Junior Member
Sep 11, 2014
13
12
81
You must be referring to the power testing hardware we used to elaborate on the RX480 power draw issues. Not only did AMD acknowledge the information we provided, they (mostly) fixed the issue. I wasn't joking, and neither were they.
I also busted out an o-scope to show differences between G-Sync and FreeSync, which not only educated folks, it likely pushed AMD to implement of Low Framerate Compensation.
Yes, I'm an electronics geek. I try to use my skill set to help the community by pushing manufacturers to improve their products.


Thanks. We still need to test on Intel quad core CPUs - they should have lower core-to-core latency as they aren't dealing with the larger ring bus. I used 5960X as the comparison point so we had matching core counts.

Allyn
I like the graphs and the work done and forgive me. What is exactly is exactly new ?
"Most assuredly that Windows scheduler had no business on Ryzen issues". Still, just like everyone else, can't really point a finger on what's is exactly wrong on there - which most assuredly means, not sure.

https://datatake.files.wordpress.com/2015/04/core2core1.png
https://datatake.files.wordpress.com/2015/04/numa2numa1.png
https://datatake.files.wordpress.com/2015/02/latency.png


core2core1.png

numa2numa1.png

latency.png

pnKNqt.png


X2ZmIXo.png


Bleh
 
Last edited:

looncraz

Senior member
Sep 12, 2011
722
1,651
136
So, if the windows schedulers isn't trying to have the two CCX's share information, then what is?

Yeah, my testing seems to suggest that Windows 10, in its default state, is not load balancing across the CCXes, but will in high performance mode... BUT load balancing seems very limited in high performance mode as it stands, so the impact is minor.

I think the problem lies solely with thread/process affinity in Windows 10. I know quite a few apps that set a mask for only real cores (to avoid logical cores) - they will perform horridly on Windows 10 with Ryzen because they then get stuck on just two cores.

W10_HighPerformance_3GHz_Ryzen_CR15_8T_SMT_ON_Affinity_0246.jpg


That is EIGHT Cinebench R15 threads... forced onto two cores. Background tasks are being run on the logical cores... and the other two cores were parked. This was the High Performance power mode, as well, I just used Process Lasso to force affinity 0, 2, 4, 6 to Cinebench R15.

Setting affinity 0, 1, 2, 3 works as expected. AND setting 0, 2, 4, 6 affinity on an Intel 2600k works as expected with the same build of Windows 10.

UPDATE:

This problem goes away completely when SMT is disabled in the BIOS (just got this option this morning).

However, without SMT, Windows 10 now load-balances across the CCXes in a very interesting manner. More on that later... still running tests.
 
Last edited:

OrangeKhrush

Senior member
Feb 11, 2017
220
343
96
from my experience it seems as though Windows 10 is mis managing the allocation of cores and threads, and is loading a single sid e of the CCX leaving it saturated while the other gets lighter loads, as we know this when information needs to be moved results in latency in the transfer.

I agree that the Schedular is not a 20% type thing, but to go out and say its not a problem is pure journalistic negligence.
 

looncraz

Senior member
Sep 12, 2011
722
1,651
136
from my experience it seems as though Windows 10 is mis managing the allocation of cores and threads, and is loading a single sid e of the CCX leaving it saturated while the other gets lighter loads, as we know this when information needs to be moved results in latency in the transfer.

I agree that the Schedular is not a 20% type thing, but to go out and say its not a problem is pure journalistic negligence.

Well... it's an 80% kind of problem if applications are manually setting affinity - they get forced to just two cores!

In most cases, though, the problem is minimal. I'm actually seeing higher performance (marginally) in the likes of Cinebench with 2+2 versus 4+0 simply because of the extra L3 cache. Games, however, are universally harmed (though I only am testing BF1, BF4, Heaven, Valley, and FireStrike).

Currently running 2+2 / 4T, tests. Load balancing across the CCXes is intense, so far, but does favor the first CCX.
 
  • Like
Reactions: T1beriu and Drazick

imported_jjj

Senior member
Feb 14, 2009
660
430
136
Well... it's an 80% kind of problem if applications are manually setting affinity - they get forced to just two cores!

In most cases, though, the problem is minimal. I'm actually seeing higher performance (marginally) in the likes of Cinebench with 2+2 versus 4+0 simply because of the extra L3 cache. Games, however, are universally harmed (though I only am testing BF1, BF4, Heaven, Valley, and FireStrike).

Currently running 2+2 / 4T, tests. Load balancing across the CCXes is intense, so far, but does favor the first CCX.

Doing any 3+3? That german site that did a few tests did it with 4+2.
 

looncraz

Senior member
Sep 12, 2011
722
1,651
136
Is there a risk , that when thread gets bounced from one CCX to another, that the L2 and L3 of another CCX will be used instead of local ones?

No, the thread context is moved with the thread. L3 data is not part of the context - and L2 data, strictly speaking, isn't necessarily so, either.
 
  • Like
Reactions: Drazick

Pookums

Member
Mar 6, 2017
32
13
36
Well... it's an 80% kind of problem if applications are manually setting affinity - they get forced to just two cores!

In most cases, though, the problem is minimal. I'm actually seeing higher performance (marginally) in the likes of Cinebench with 2+2 versus 4+0 simply because of the extra L3 cache. Games, however, are universally harmed (though I only am testing BF1, BF4, Heaven, Valley, and FireStrike).

Currently running 2+2 / 4T, tests. Load balancing across the CCXes is intense, so far, but does favor the first CCX.

Do you have a broadwell/skylake to test, or just the older Sandybridges to compare to Ryzen? Im asking because of a message i posted in this thread https://forums.anandtech.com/threads/ryzen-a-fail-for-gamers.2500643/page-23 . I would like someone to downclock the Uncore speeds in intel to 1/2 ratio of MEMCLK like ryzen does, and then compare memory latencies, majincries drawcall bench, and games.

Testing this with sandybridge might suffice somewhat, but am hoping to see it compared to skylake/broadwell.
 

HurleyBird

Platinum Member
Apr 22, 2003
2,670
1,250
136
im pretty sure the ring bus is dual counter rotating rings, so average latency ( assuming 50% go left 50% go right) would be the same.

Or maybe it's just unidirectional? So the time total to complete the circuit is always the same, eg. if a core messages another core adjacent and directly downstream, the query gets their quickly, but the response takes much longer.
 

malventano

Junior Member
May 27, 2009
18
19
76
PCPer.com
I'm referring to all the 'special' test PCPer busts out on an AMD launch, yet has to be dragged tooth and nail to even acknowledge issue like the 4GB/3.5GB memory issue with the 970.

The 'dragged tooth and nail' you are referring to was actually multiple of days worth of us testing and retesting, calls to vendors, trying to replicate the very unique worst case scenario that was being reported all over as some devious scandal. The reason for such additional testing was that we were not seeing the issue to the same extreme as other reports were indicating. Instead of just jumping the gun and posting 'we don't see it', we spent the additional time to push the systems / games / VRAM to the point where we could see it. In the end, we had to push upwards of 150% of 4k resolution, which I should remind you is still less than 1% of the current install base over two years later.

Going back to your original statement, if you are referring to Frame Rating as 'special tests' we busted out, I should point out that we have been using Frame Rating on pretty much every single GPU review since Jan 2013. We did not 'bust out' a special thing to investigate that issue. The then 2-year old tool set was simply used to show that the issue turned out to not be as drastic as some folks were making it out to be.

I don't see how investigating issues and reporting our findings makes us 'jokers', but whatever floats your boat I guess.
 
  • Like
Reactions: CHADBOGA

malventano

Junior Member
May 27, 2009
18
19
76
PCPer.com
Or maybe it's just unidirectional? So the time total to complete the circuit is always the same, eg. if a core messages another core adjacent and directly downstream, the query gets their quickly, but the response takes much longer.

The test used issues one-way pings. The times are not round trip. And yes I have the same question about why 'closer' cores on the ring did not have shorter times. It's possible the ring is bi/counter-directional or perhaps getting to/from the ring is what takes the majority of the time.
 
  • Like
Reactions: HurleyBird

imported_jjj

Senior member
Feb 14, 2009
660
430
136
The 'dragged tooth and nail' you are referring to was actually multiple of days worth of us testing and retesting, calls to vendors, trying to replicate the very unique worst case scenario that was being reported all over as some devious scandal. The reason for such additional testing was that we were not seeing the issue to the same extreme as other reports were indicating. Instead of just jumping the gun and posting 'we don't see it', we spent the additional time to push the systems / games / VRAM to the point where we could see it. In the end, we had to push upwards of 150% of 4k resolution, which I should remind you is still less than 1% of the current install base over two years later.

Going back to your original statement, if you are referring to Frame Rating as 'special tests' we busted out, I should point out that we have been using Frame Rating on pretty much every single GPU review since Jan 2013. We did not 'bust out' a special thing to investigate that issue. The then 2-year old tool set was simply used to show that the issue turned out to not be as drastic as some folks were making it out to be.

I don't see how investigating issues and reporting our findings makes us 'jokers', but whatever floats your boat I guess.

Isn't it odd how your 6900k at 3.5GHz scores the same as it does at default clocks where ST should be at 4GHz? Clearly both tests are run at 3.7GHz so default without Turbo 3.

clock-audacity.png
clock-cb15-1.png

audacity.png
cb15-1.png
 
  • Like
Reactions: MajinCry

lolfail9001

Golden Member
Sep 9, 2016
1,056
353
96
Isn't it odd how your 6900k at 3.5GHz scores the same as it does at default clocks where ST should be at 4GHz?
Since when is default ST clock on 6900k is 4Ghz? Last time i checked most reviewers not named AMD disable Turbo Max stuff. And in fact, that is in fact seen here, as 4Ghz 6900k hits 160 points in Cinebench, not 150.

But that's way off topic.

This problem goes away completely when SMT is disabled in the BIOS (just got this option this morning).
Damn, i do not know what went wrong with Win10 or Process lasso here, but something absolutely did.
 

unseenmorbidity

Golden Member
Nov 27, 2016
1,395
967
96
The 'dragged tooth and nail' you are referring to was actually multiple of days worth of us testing and retesting, calls to vendors, trying to replicate the very unique worst case scenario that was being reported all over as some devious scandal. The reason for such additional testing was that we were not seeing the issue to the same extreme as other reports were indicating. Instead of just jumping the gun and posting 'we don't see it', we spent the additional time to push the systems / games / VRAM to the point where we could see it. In the end, we had to push upwards of 150% of 4k resolution, which I should remind you is still less than 1% of the current install base over two years later.

Going back to your original statement, if you are referring to Frame Rating as 'special tests' we busted out, I should point out that we have been using Frame Rating on pretty much every single GPU review since Jan 2013. We did not 'bust out' a special thing to investigate that issue. The then 2-year old tool set was simply used to show that the issue turned out to not be as drastic as some folks were making it out to be.

I don't see how investigating issues and reporting our findings makes us 'jokers', but whatever floats your boat I guess.
But didn't you jump the gun here? Your argument seemed to be "It's working fine in this one particular circumstance, so therefore it's always working fine".
 

Dresdenboy

Golden Member
Jul 28, 2003
1,730
554
136
citavia.blog.de
Thanks. We still need to test on Intel quad core CPUs - they should have lower core-to-core latency as they aren't dealing with the larger ring bus. I used 5960X as the comparison point so we had matching core counts.

Allyn
What exactly is your latency measurement tool doing? I'm looking for a possible cause for UMC involvement, as transferring a 64B cacheline between 2 CCXs even with some hops inbetween should never take ~130 data fabric cycles, if the actual data transfer just needs 2.
 
May 11, 2008
19,300
1,129
126
A Diagram of Ryzen’s Clock Domains
For the past few days, there have been talks around tech forums about Ryzen’s clock domains. Specifically about how some parts of the internal fabric of Ryzen run at memory clockspeed, or half effective transfer speed. Thanks to hardware.fr, we now have a diagram of the clock domains in Ryzen.


From the above diagram, we can conclude there are three major clock domains in Ryzen:

  • CClk (Core Clock): The speed advertised on the box, and the speed at which the cores and cache run at
  • LClk (Data Launch Clock): A fixed frequency at which the IO Hub Controller (PCI-E and friends) operates
  • MemClk (Memory Clock): The memory clock speed, half of the number you see advertised (1.3GHz for 2667, as an example)

As can be seen in the diagram, the internal Data Fabric, part of the Infinity Fabric advertised by AMD, runs in the MemClk domain.

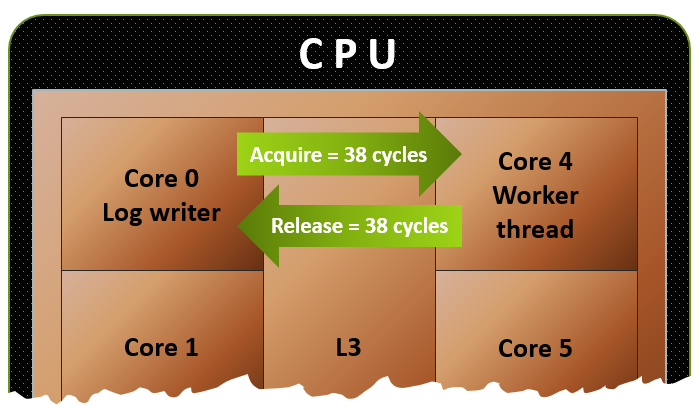
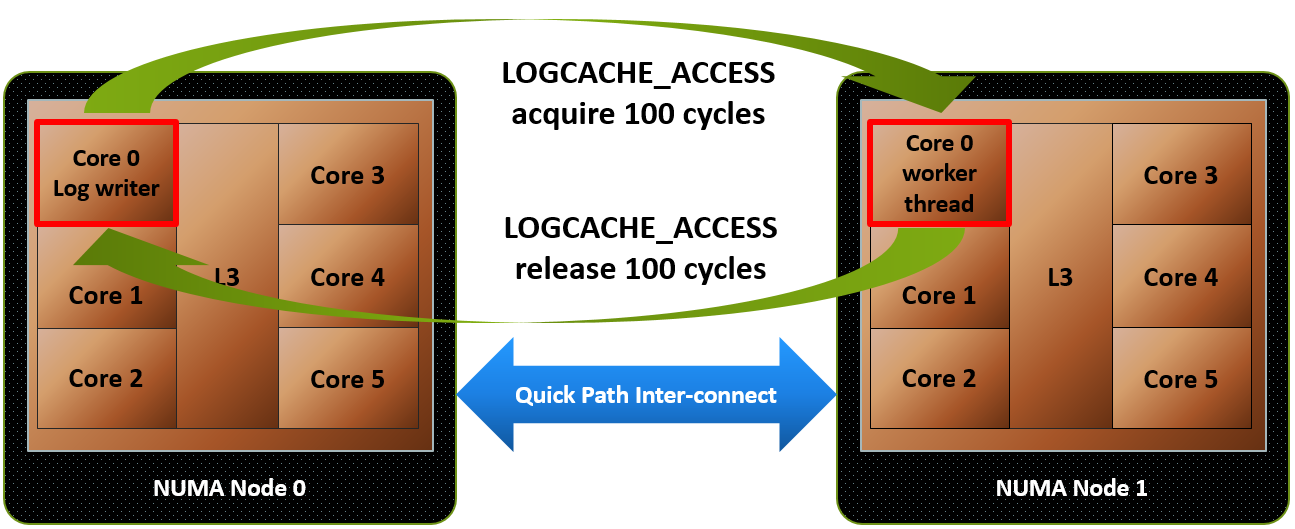
The Data Fabric is reponsible for the core’s communication with the memory controller, and more importantly, inter-CCX communication. As previously explained, AMD’s Ryzen is built in modular blocks called CCX’s, each contianing four cores and its own bank of L3 cache. An 8 core chip like Ryzen contains two of these. In order for CCX to CCX communication to take place, such as when a core from CCX 0 attempts to access data in the L3 cache of CCX 1, it has to do so through the Data Fabric. Assuming a standard 2667MT/s DDR4 kit, the Data Fabric has a bandwidth of 41.6GB/s in a single direction, or 83.2GB/s when transfering in both directions. This bandwidth has to be shared between both inter-CCX communication, and DRAM access, quickly creation data contention whenever a lot of data is being transfered from CCX to CCX at the same time as reading or writing to and from memory.


Memory Scaling
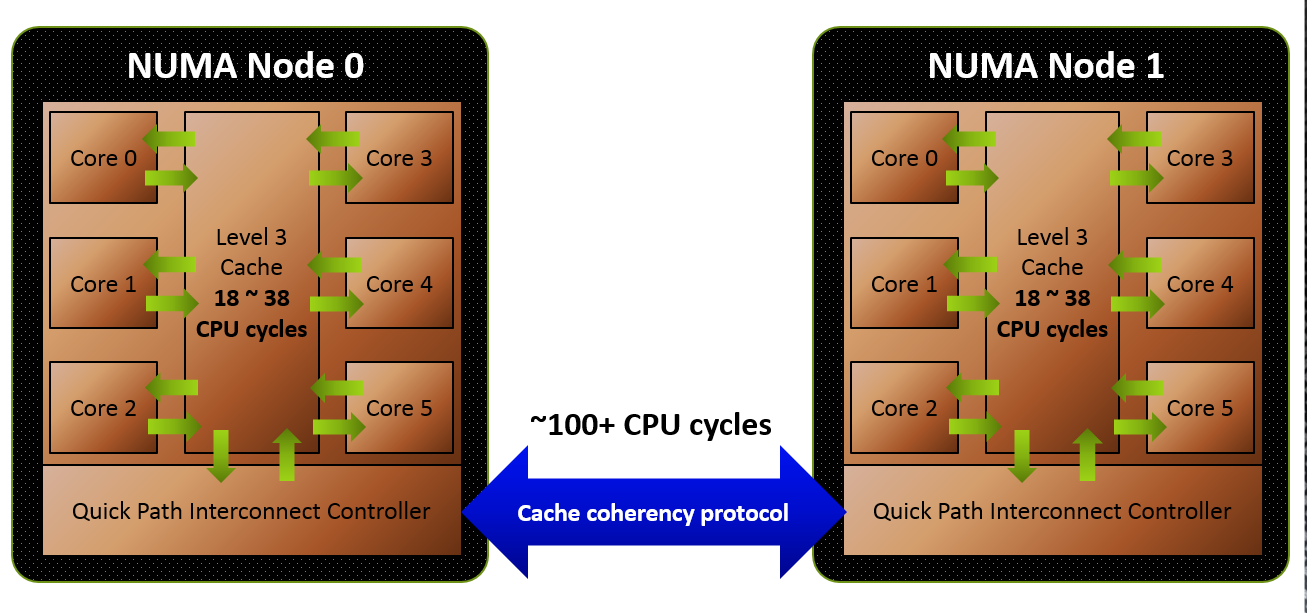
To put things into perspective, communication to and from cores to L3 cache inside the same CCX happens at around 200GB/s. Combine this with the massive difference in latency you would expect from having to go through extra hoops to reach the other CCX, and the communication speed between CCX’s is simply not anywhere near intra-CCX communication speeds. This is why changing the Windows scheduler to keep data from a single thread in the same CCX is so important, as otherwise you incur a performance penalty, as observed in gaming performance tests.

As observed in multiple tests, Ryzen appears to scale quite well with memory speeds, and this knowledge sheds light on why. It’s not necessarily the increased speeds with the DDR4 kits themselves, though it certainly helps. Rather, it’s the increased internal bandwidth for inter-CCX communication, which alleviates some of the performance issues when threads have to communicate between CCX’s.

Due to this, if you’re picking up a Ryzen system, it’s highly recommended to get a decently fast memory kit, as it will help performance more than you would otherwise expect.


Why is it built this way?
Well, the answer is quite simple. AMD as a semi-custom company, would like to have modularity in their designs. Instead of building a large monolithic 8 core complex that would be relatively hard to scale, they’ve created a quad core building block, from which they can scale core counts as as they see fit. This reduces design costs and time to market for their customers.

There is a trade off, as detailed above. However, as seen in the impressive performance of Ryzen, it’s not too hampering. As soon as the Windows scheduler gets updated to minimize movement of data between CCX’s, and developers release patches in the few games where that will not be enough to solve issues, the gaming performance should be similar to the performance of a 6900K, just like with professional workloads.

https://thetechaltar.com/amd-ryzen-clock-domains-detailed/


Very interesting.
Thank you.
This sure gives me the strong intuitive feeling that zen2 will have a ccx with 8 native cores.
 

imported_jjj

Senior member
Feb 14, 2009
660
430
136
Since when is default ST clock on 6900k is 4Ghz? Last time i checked most reviewers not named AMD disable Turbo Max stuff. And in fact, that is in fact seen here, as 4Ghz 6900k hits 160 points in Cinebench, not 150.

But that's way off topic.


Damn, i do not know what went wrong with Win10 or Process lasso here, but something absolutely did.

You are going on the ignore list as it's your third strike of pure trolling in a week. Then again, you are Trump supporter, wth should i expect.
Turbo 3 is a features listed by Intel, anyone disabling it is unfairly penalizing Intel.
MICE is a mobo OC that should be disabled.
PCper tests the 6900k at 3.7GHz ST in both cases and if you don't see it, i suggest you seek medical help.

Insulting other members is not allowed.
Not to mention this is a technical forum, and not the place for politics.
Markfw
Anandtech Moderator
 
Last edited by a moderator:

looncraz

Senior member
Sep 12, 2011
722
1,651
136
Doing any 3+3? That german site that did a few tests did it with 4+2.

I don't have a 4+2 option, only 3+3. But, yes, I'm doing at least some testing for the following configurations:

2 + 2 / 4T
4 + 0 / 4T

2 + 2 / 8T
4 + 0 / 8T

3 + 3 / 6T
3 + 3 / 12T

4 + 4 / 8T
4 + 4 / 16T

3Ghz, stock, OC (not sure what it will hit, but 3.8Ghz is easy as setting the P0 state).

I'm not doing any power numbers because my setup is... makeshift (I have the board on a box with components strung around everywhere... it's a mess. When I get my ASUS C6H and build my proper rig I will do power testing as an independent venture.

Stock settings have Cool-n-Quiet and all that jazz enabled with DDR3-2133, all other settings have all power management settings disabled and are at all-core fixed frequencies, overclock uses DDR4-2667 CL15 settings (because I can't get it to go any higher, despite using DDR4-3200 CL16 RAM... this RAM is not known to be 1T stable at those clocks... and I can't manually override the command rate).
 
  • Like
Reactions: T1beriu and Drazick

Pookums

Member
Mar 6, 2017
32
13
36
What exactly is your latency measurement tool doing? I'm looking for a possible cause for UMC involvement, as transferring a 64B cacheline between 2 CCXs even with some hops inbetween should never take ~130 data fabric cycles, if the actual data transfer just needs 2.

Does Infinity fabric have fine tuned modules which act more like Pipelines? For example if we go by the linked chart showing cycles, maybe each B/cycle has its own bandwidth pipeline on infinity fabric, unlike ringbus to UMC on intel. So using a completely different mechanical architecture purely as an analogy -> (UMC into ringbus is to HDD controller as UMC into infinity fabric is to flash controller). Perhaps like other previous issues, the data is simply being recorded wrong.

2 ccx x 32 pipes x 2(one ccx to another and back) = 64 x 2 = 128. The 128 represents incorrect reading of pipe access and its adding that to total measured cycles when it never occured. Add 2 true cycles of access and you end up with 130.

I have no idea if this is the case, it is pure conjecture. However, its the only thing I can recognize off the top of my head using the chart of 32b/cycle UMC to fabric crosstalk that could logically add up to 130measured cycles.
 
Status
Not open for further replies.