Is this stock or tweaked? Not that it matters, reviews should settle this sometime in the near future.I see his 5600Х cpu-z mt score is a bit on a low side.
-
We’re currently investigating an issue related to the forum theme and styling that is impacting page layout and visual formatting. The problem has been identified, and we are actively working on a resolution. There is no impact to user data or functionality, this is strictly a front-end display issue. We’ll post an update once the fix has been deployed. Thanks for your patience while we get this sorted.
You are using an out of date browser. It may not display this or other websites correctly.
You should upgrade or use an alternative browser.
You should upgrade or use an alternative browser.
Discussion Intel current and future Lakes & Rapids thread
Page 565 - Seeking answers? Join the AnandTech community: where nearly half-a-million members share solutions and discuss the latest tech.
PJVol
Senior member
76W is stock PPT limit, so yes.Is this stock or tweaked?
Here is tweaked (not OC-ed, just PBO & CO):

Last edited:
Stock, yes, but are you using Curve Optimizer or applying some type of undervolting? Because if you are, your result is not exactly stock.
So 12400 has the same efficiency or a bit better than 5600x at least If It's at 4GHz, right? How did you come to the conclusion that ADL is hugely more efficient than Tiger Lake? Zen3 is not that much more efficient at higher power draw than Tiger Lake.
Techspot
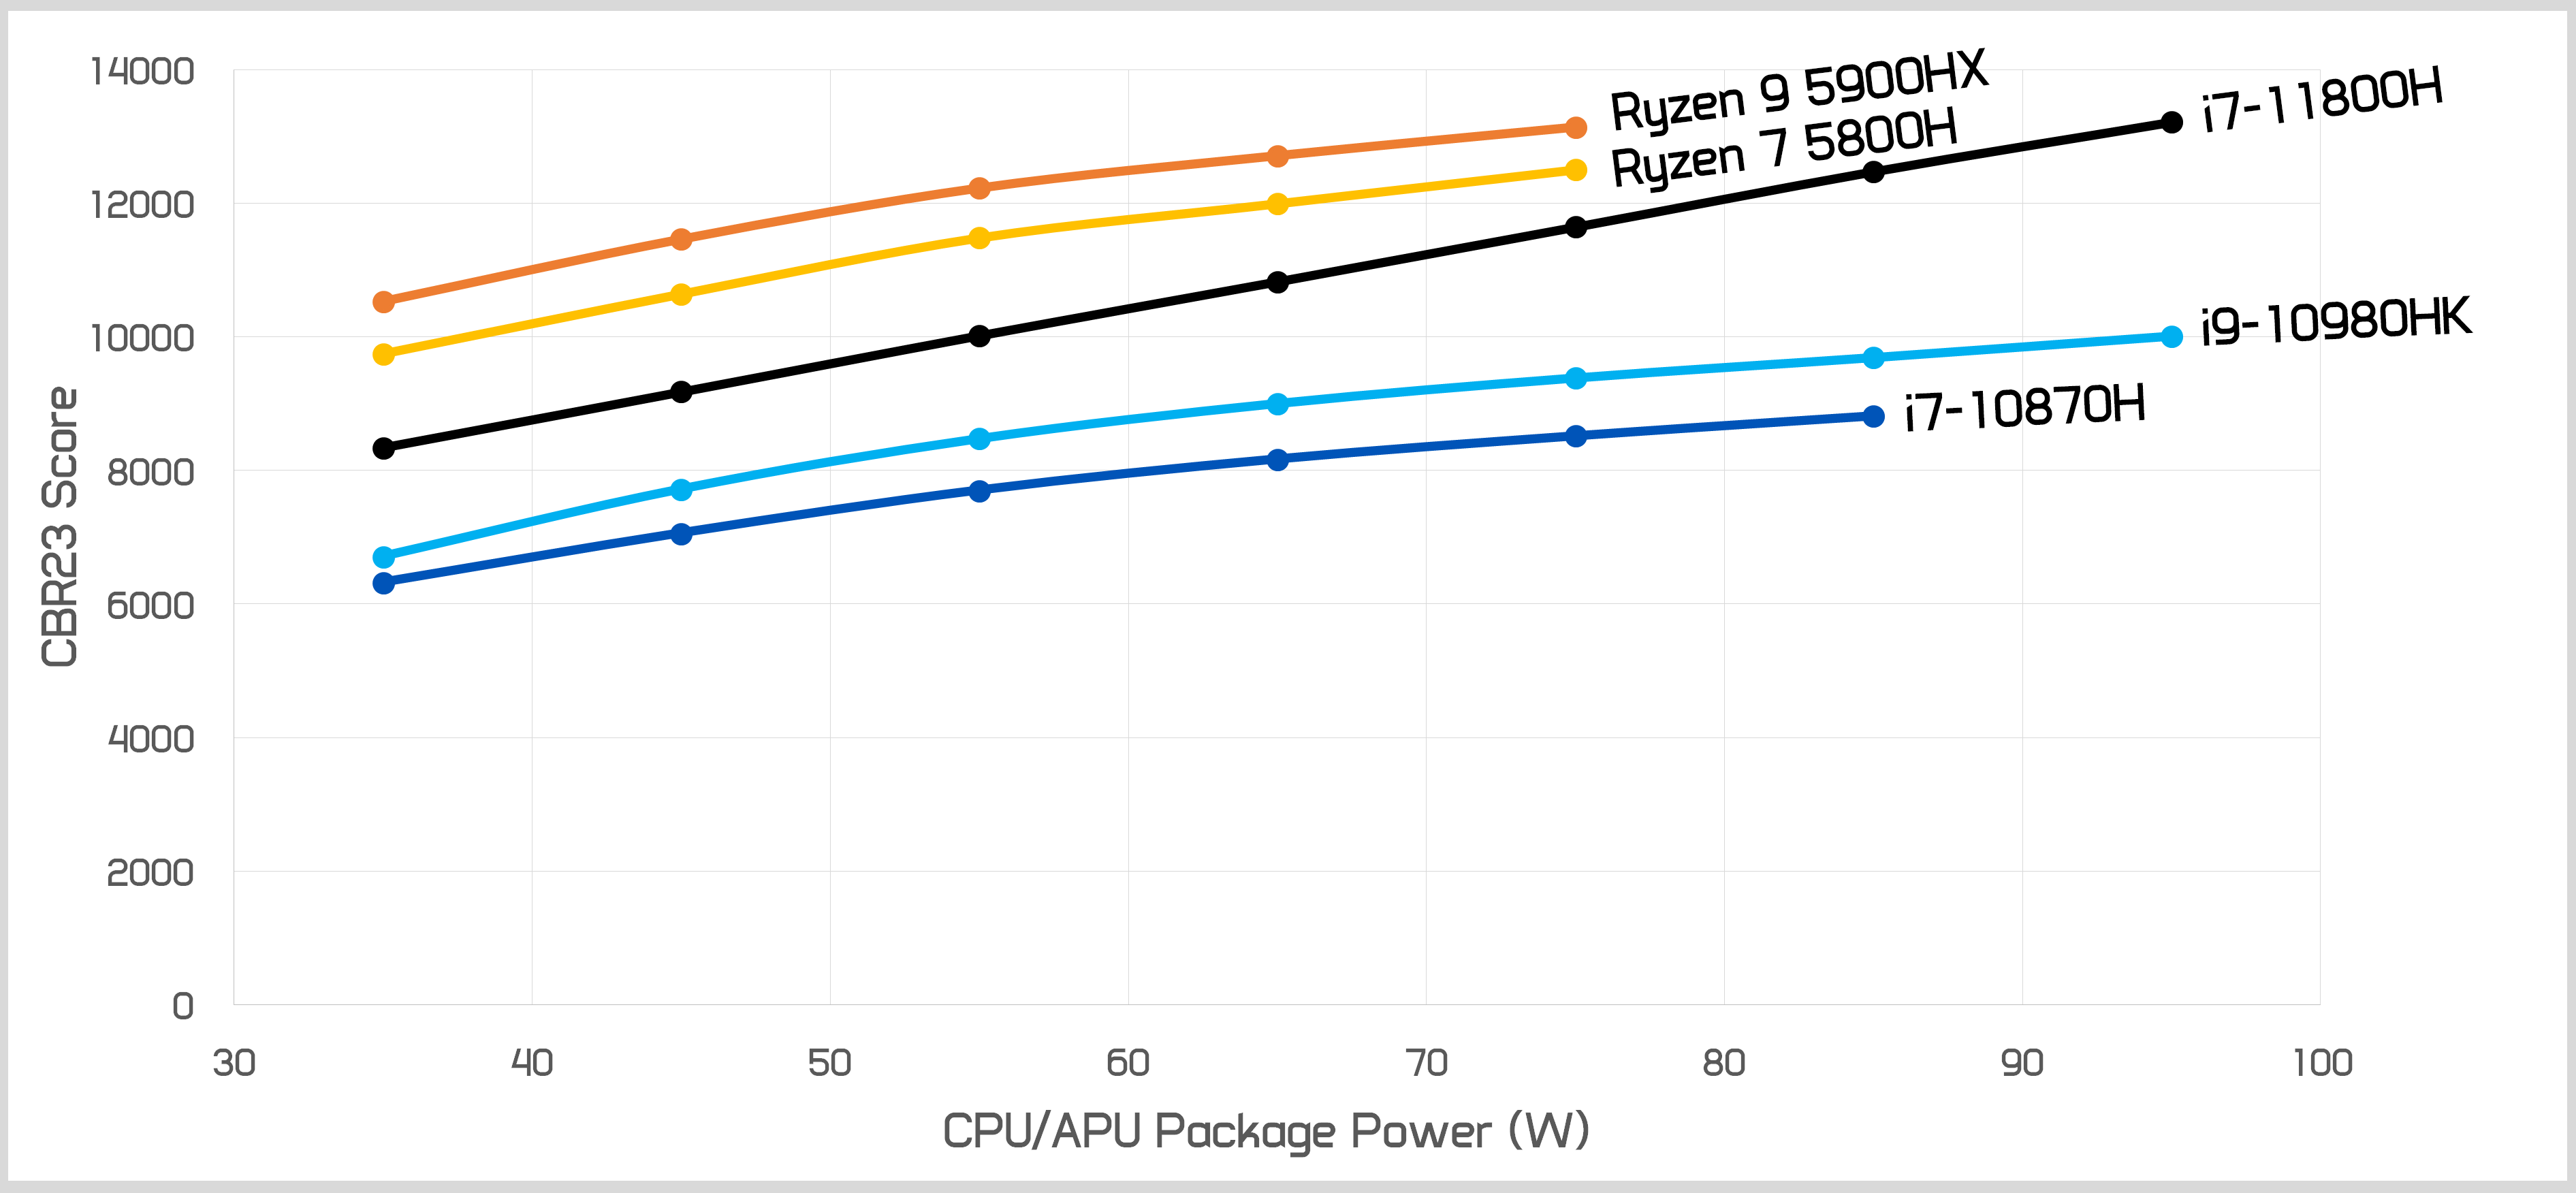
At 75W Zen3 is about 10-13%. I can't say that is a huge increase in efficiency.
Tigerlake is clearly below Zen 3 in efficiency, that's why. This is based on several reviews or other tests like this. The Tigerlake based NUC didn't look great either. The i5-12400 seems to have a 5-10% efficiency advantage over a comparable Zen 3, this is overall a huge improvement to me.
TESKATLIPOKA
Platinum Member
My graph also shows that Tiger Lake is under Zen 3, but with increased TDP the difference becomes smaller.Tigerlake is clearly below Zen 3 in efficiency, that's why. This is based on several reviews or other tests like this. The Tigerlake based NUC didn't look great either. The i5-12400 seems to have a 5-10% efficiency advantage over a comparable Zen 3, this is overall a huge improvement to me.
Considering how low Alder Lake needs to be clocked to be within 125W(P: ~3.6GHz and E: ~2.8GHz), based on the R20 leak, I seriously doubt It is more efficient than Zen 3.
Last edited:
The CPUZ benchmark, especially version 17, takes less power than the AIDA64 FPU stress test. Since the power consumption of the 12400 was not reported for the CPUZ bench, the example had to first determine the clock speed of the 5600X needed to match the 12400 in CPUZ (4.5GHz) then run the AIDA64 stress test at that clock speed to come up with the closest equivalent power figure.I see his 5600Х cpu-z mt score is a bit on a low side.
PJVol
Senior member
I don't get what relation cpu clock has to power consumed when comparing different architectures. What was the goal then? Can it be approximated this way?the example had to first determine the clock speed of the 5600X needed to match the 12400 in CPUZ
PS: If I get what was on screenshot right, during the AIDA FPU test it consumed 78W ?
What makes you think then, that in CPU-Z it would consume less, I mean what this is based on?
Last edited:
My graph also shows that Tiger Lake is under Zen 3, but with increased TDP the difference becomes smaller.
Considering how low Alder Lake needs to be clocked to be within 125W(P: ~3.6GHz and E: ~2.8GHz), based on the R20 leak, I seriously doubt It is more efficient than Zen 3.
I'm not talking about 125 watts nor E-cores, I'm talking about Golden Cove and mobile. Once again the 12400 (it's a 6+0 model) looks very promising and therefore it's promising for mobile as well. 78W in AIDA64 FPU could result in 70W Cinebench MT running at 4.0 Ghz. 5600x requires the same if not more power in Cinebench and runs slower. I haven't seen any reliable 125W ADL-S test by the way. The leak you are probably talking about isn't reliable, the 125W score is too low a tester hinted.
TESKATLIPOKA
Platinum Member
What I posted should be an official Lenovo presentation If I understood It correctly.I'm not talking about 125 watts nor E-cores, I'm talking about Golden Cove and mobile. Once again the 12400 (it's a 6+0 model) looks very promising and therefore it's promising for mobile as well. 78W in AIDA64 FPU could result in 70W Cinebench MT running at 4.0 Ghz. 5600x requires the same if not more power in Cinebench and runs slower. I haven't seen any reliable 125W ADL-S test by the way. The leak you are probably talking about isn't reliable, the 125W score is too low a tester hinted.
Golden cove should be less efficient than Gracemont and you don't really need higher clocks to achieve those 125W. It's enough to add 2 more Golden Cove cores and 8 Gracemont cores.
You say 78W for a 4GHz 6 Core Golden Cove is very promising, so I tried to apply It to 12900K.
Let's say from those 70W -> 10W is per core at 4GHz and 10W for uncore, If you add 2 more cores, then you end up with 90W, that leaves 35W for 8x Gracemont cores.
You are right, that 7492 points for 12900K looks pretty low, If 12400 really manages 4784 points. It would mean only 56% better performance, and that is a very low score for 8C+8c If an 8 core at 4GHz should manage 6377 points(4784 * 1.333). It would mean 8 Gracemont cores provide only ~18% better performance, that's worse than what SMT provides. I would expect ~50% higher performance in Cinebench.
Last edited:
PJVol
Senior member
What are you guys talking about? How can cpu consume less or more than what is deifined by the power limit preset in these tests?78W in AIDA64 FPU could result in 70W Cinebench MT running at 4.0 Ghz. 5600x requires the same if not more power in Cinebench and runs slower
You are right, that 7492 points for 12900K looks pretty low, If 12400 really manages 4784 points. It would mean only 56% better performance, and that is a very low score for 8C+8c If an 8 core at 4GHz should manage 6377 points(4784 * 1.333). It would mean 8 Gracemont cores provide only ~18% better performance, that's worse than what SMT provides. I would expect ~50% higher performance in Cinebench.
In Cinebench R23 there is only a ~15% difference between 125W and unlimited (260W) on a 12900k.
What are you guys talking about? How can cpu consume less or more than what is deifined by the power limit preset in these tests?
No power limit but limited by the multithread turbo clock speed in the first place. i5-12400 is limited to 4.0 Ghz when all cores are loaded. Stress tests with higher AVX load are usually more demanding on Intel CPUs, depending on the workload the power consumption can differ.
It's a rough approximation but it's something for the curious and enthusiasts to do while waiting for the review embargo to lift.I don't get what relation cpu clock has to power consumed when comparing different architectures. What was the goal then? Can it be approximated this way?
Based on the behavior on Tiger Lake-H that I see. On an Inspiron 16 Plus laptop, at 8x3.4GHz (undervolted) results in 56W maximum package power in AIDA64 FPU, 50W in Cinebench R23 and just slightly more than 36W in CPUZ v17 benchmark.PS: If I get what was on screenshot right, during the AIDA FPU test it consumed 78W ?
What makes you think then, that in CPU-Z it would consume less, I mean what this is based on?
PJVol
Senior member
Oh really...? Is it mobile parts specific or it applies to all 11 series? Didn't know that.Based on the behavior on Tiger Lake-H that I see
I just have both mobile and desktop ryzen chips (5700g and 5600x) and their behavior is rather straightforward regarding power, i.e. consuming whatever is allowed by power or sustained current limit.
Ah, yes, I see. Didn't know that.imited by the multithread turbo clock speed in the first place
Last edited:
IntelUser2000
Elite Member
It would mean 8 Gracemont cores provide only ~18% better performance, that's worse than what SMT provides. I would expect ~50% higher performance in Cinebench.
I swear, Gracemont goes from being a Bulldozer to a Conroe and back to a Bulldozer every leak.
TESKATLIPOKA
Platinum Member
I was only discussing the low score from supposedly official Lenovo marketing slides for 125W power limit.I swear, Gracemont goes from being a Bulldozer to a Conroe and back to a Bulldozer every leak.
I was not discussing If Gracemont is weak or strong.
Last edited:
In Cinebench R23 there is only a ~15% difference between 125W and unlimited (260W) on a 12900k.
It means that at 125W the CPU will do the bench at 180W on average, doing half the bench at 240W before temperature limiting the CPU at 125W for the second half of the bench.

Intel Alder Lake: i9-12900K, i7-12700K & i5-12600K vorgestellt
Mit einem großen Schritt eröffnet Intel Alder Lake die Hybrid-Ära. Core i9-12900K, i7-12700K & i5-12600K machen den Anfang. Ein Überblick.
DrMrLordX
Lifer
It means that at 125W the CPU will do the bench at 180W on average, doing half the bench at 240W before temperature limiting the CPU at 125W for the second half of the bench.
But if PL1=PL2=125W then that's not the case.
But if PL1=PL2=125W then that's not the case.
The difference would be bigger than 15%, from brick wall limit at 125W to 240W unlimited the perf difference should be around 30%.
DrMrLordX
Lifer
The difference would be bigger than 15%, from brick wall limit at 125W to 240W unlimited the perf difference should be around 30%.
Guess we'll see in a few days if reviewers are smart enough to test at fixed power levels.
coercitiv
Diamond Member
On this topic...Guess we'll see in a few days if reviewers are smart enough to test at fixed power levels.
We all enjoy a new BIOS just days before NDA is lifted, now all we need is a Win11 performance update and we're all set for crazy town.
AtenRa
Lifer
What I really like to see from reviews is taking the 12900K, disabling all 8 e-cores and compare against Ryzen 5800X at the same power consumption.
That way we could see the performance and efficiency of the new mArchitecture and Intel 7 process against last year ZEN3 and TSMC 7nm.
That way we could see the performance and efficiency of the new mArchitecture and Intel 7 process against last year ZEN3 and TSMC 7nm.
moinmoin
Diamond Member
Will be interesting to watch how transparent all the reviewers will be stating the exact version of all those moving targets. Add the inherent difficulty to do "correct" performance tests on hybrid designs and we are set for crazy town indeed.we're all set for crazy town.
CakeMonster
Golden Member
I had to wait months for my 5900X to arrive, and I thought the BIOS updates were a bit much even then. I'm kind of glad I don't have to deal with this now, adding W11 and DDR5 on top of it.
I have no doubt AL will be solid in about 6 months time. I'm very much looking forward to Raptor Lake, I figure tons of issues will have been sorted out by then and there should not be need for a whirlwind of BIOS and software updates given its more incremental design.
I have no doubt AL will be solid in about 6 months time. I'm very much looking forward to Raptor Lake, I figure tons of issues will have been sorted out by then and there should not be need for a whirlwind of BIOS and software updates given its more incremental design.
TRENDING THREADS
-
 Discussion Zen 5 Speculation (EPYC Turin and Strix Point/Granite Ridge - Ryzen 9000)
- Started by DisEnchantment
- Replies: 25K
-
Discussion Intel Meteor, Arrow, Lunar & Panther Lakes + WCL Discussion Threads
- Started by Tigerick
- Replies: 25K
-
 Discussion Intel current and future Lakes & Rapids thread
- Started by TheF34RChannel
- Replies: 24K
-

-
