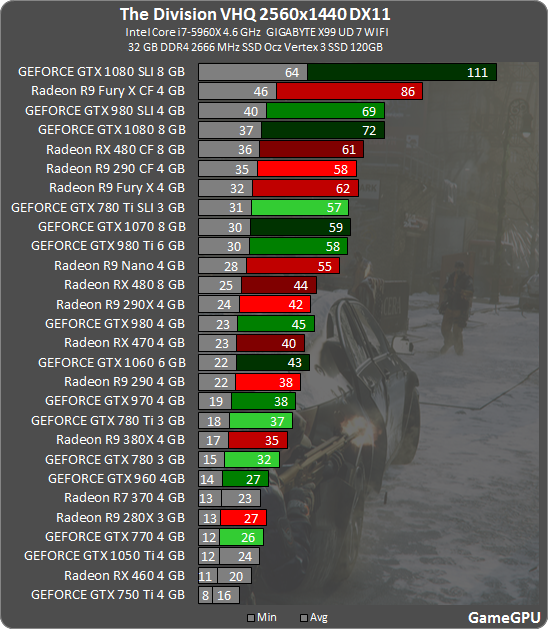
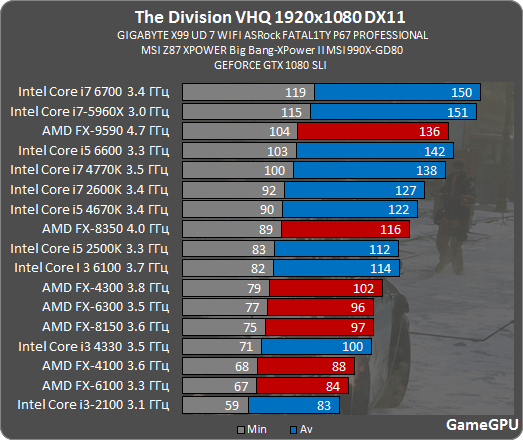
Yeah their graphing is bad. They add the min + avg on their graph length, instead of having the min take up part of the avg. So 31 min, 51 avg would look much larger than 13 min, 60 avg even though the 2nd one has higher avg overall. I don't know how they handle min either, if its 99% or single lowest or what.
I'm not sure of the specifics either, so I hope someone can chime in. And not simply about the min + avg thing, I think that's almost obvious enough to slide (although it can be misleading especially considering below).
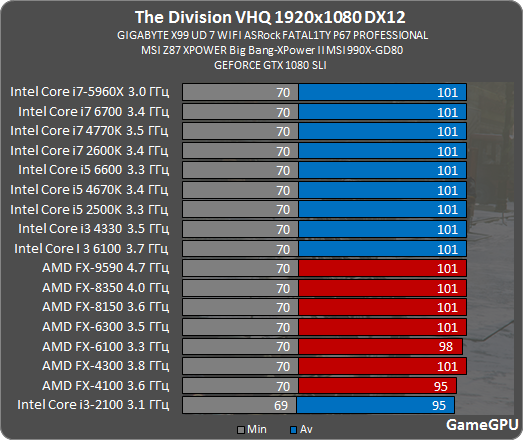
It's the fact they order by "min" rates first, but if min is equal it appears they list Intel or nV above AMD. It sounds paranoid so in the past I've guessed they're using another next decimal place in "min" (not published), but the graphs above appear to confirm my tinfoil hat theory that if mins are equal they will list Intel/nV above AMD (and I have noticed nV products listed above AMD products with equal "min"s, but AMD has higher "avg" fps).
Obviously if you ordered your graphs by "min" fps first, if you have a tie you should then order those tied objects by "avg", but it appears they don't bother doing this. They simply list Intel/nV products higher on their graphs when they have equal "min"s even though the AMD product may have a higher "avg" fps.
I would be happy to be proven wrong in this, but I've seen it enough times to feel confident ranting about it...


 Discussion Zen 5 Speculation (EPYC Turin and Strix Point/Granite Ridge - Ryzen 9000)
 Discussion Intel current and future Lakes & Rapids thread
