coercitiv
Diamond Member
Of course my reply was one of disbelief, since you're not making any sense.Your original argument
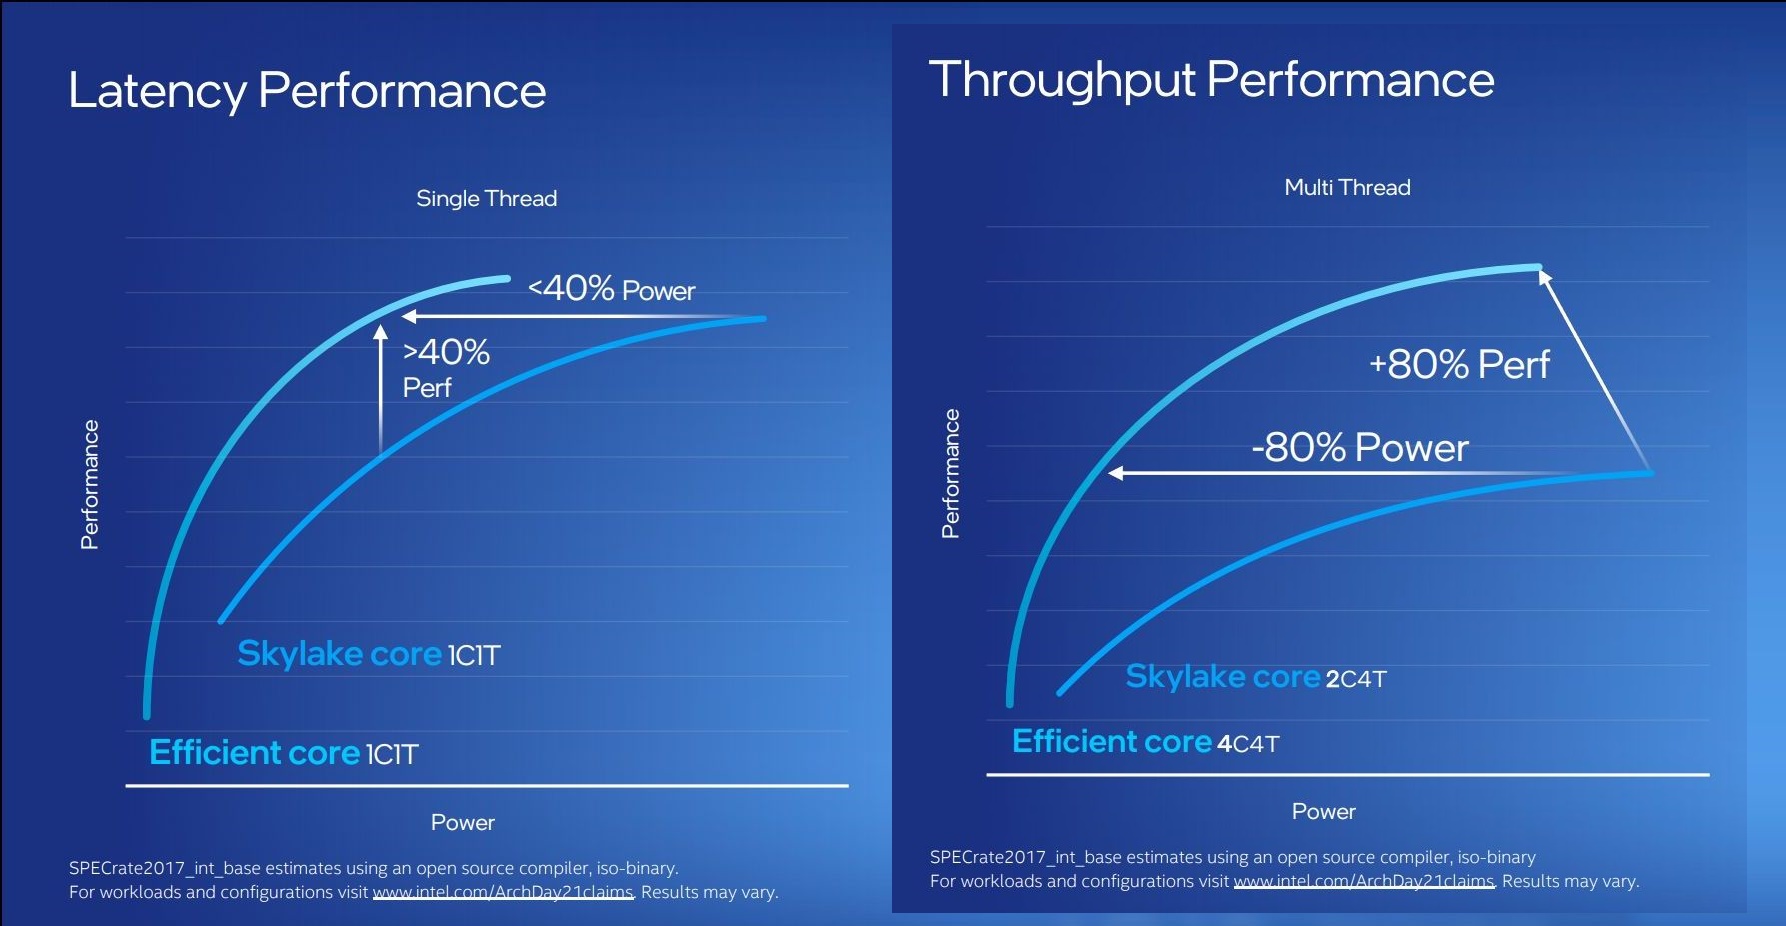
Me: Shows graph
According to @IntelUser2000 estimates:
- Gracemont is a ~1.5mm2 core
- Golden Cove is a ~ 8mm2 core
The fact that other companies have small cores with excellent IPC does not change the other major fact that Intel's choices are limited to their IP and they chose to allocate 80% of core area to Cove instead of Atom.