i7-3770K vs. i7-2600K: Temperature, Voltage, GHz and Power-Consumption Analysis

Idontcare

Elite Member
Oct 10, 1999
21,118
58
91
It has been just a little over a year now since I posted my deep-dive analysis of the dependence of power-consumption with temperature, clockspeed, and cpu voltage for my 32nm i7-2600K cpu (sandy bridge) and I felt like it would be a nice evolution to perform a similar analysis of my 22nm i7-3770K cpu (ivy bridge).

Now in order to generate data on the 3770k which would be more amenable to an apples-to-apples comparison with the 2600k (which was lapped, soldered, etc) I went to some efforts to improve on the baseline stock thermals of the IB chip. Those efforts included lapping the IHS as well as delidding the IHS and replacing the CPU TIM.

In the course of those efforts we learned that the stock CPU TIM itself is not the culprit behind the high operating temperatures of Ivy Bridge; rather, the primary culprit is the gap that exists between the CPU silicon die and the underside of the IHS (the gap being filled with TIM of course).

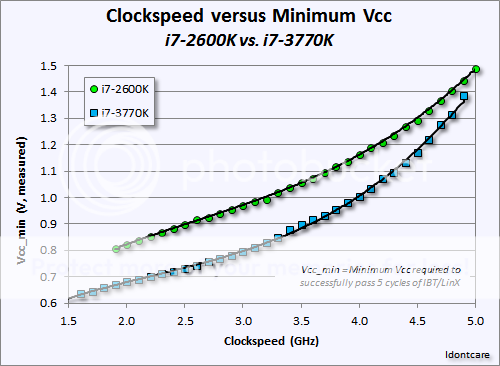
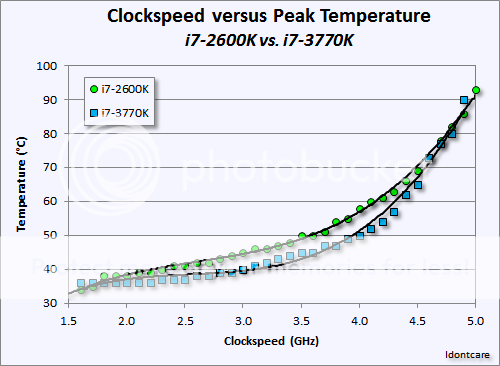
Eliminating that gap, or replacing the CPU TIM with a TIM that has thermal conductivity comparable to that of pure metal in the first place (as Intel accomplishes with their solder on 32nm Sandy Bridge, and as enthusiasts accomplish with metal-TIM substitutes such as Coollaboratory Liquid Ultra) results in dramatically lower operating temperatures for Ivy Bridge cpus when the clockspeeds get into the 4.5GHz territory and higher.

Armed with my delidded i7-3370K, my lapped H100 and NH-D14, and an Asus Maximus IV Extreme-Z (aka MIVE-Z), I spent the last month or so finding hours here and there to compile a bit of data which fleshes out the power-consumption profile for my 3770k as a function of CPU voltage, clockspeed, and operating temperature.

Hardware Setup and Configuration during Testing:
  • Mobo: ASUS Maximus IV Extreme-Z (3402 bios rev)
  • CPU: i7-2600K (lapped to 3000 grit) and i7-3770k (lapped to 3000 grit, delidded and CPU TIM replaced with NT-H1)
  • Ram: 16GB (4x4GB) G.SKILL Ripjaws X Series DDR3-2133 Model F3-17000CL11Q-16GBXL (configured to run at DDR3-1866 1.5V 10-10-10-28-T1)
  • SSD OCZ Vertex 3 VTX3-25SAT3-240G 240GB
  • GPU: MSI N460GTX CYCLONE GTX 460 at 900MHz/1.1V (delidded, cooled with Artic Cooling Accelero XTREME Plus)
  • PSU: CORSAIR Professional Series Gold AX850 (CMPSU-850AX)
  • HSF: Corsair H100 and Noctua NH-D14 (both lapped to 3000 grit)
  • OS: Win7 x64 Ultimate
To acquire the data I took advantage of something ASUS calls the "ProbeIt" feature on their ROG mobos. This allows me to connect an external voltmeter directly to the motherboard and monitor the actual applied cpu voltage versus relying solely on the software-based measurements and Vcc reporting through the BIOS and applications like CPUz.

MIVE-ZProbeIt.jpg


Just as was done in the analysis of the 2600k, power-consumption data was monitored "at the wall" with a kill-a-watt power monitor for the entire system (sans the LCD) and then an analysis is done to extract the platform power usage (including AC/DC power losses by the PSU itself) afterwards.

Kill-a-wattsetup.jpg


In order to have control over the operating temperature of the CPU without changing the platform's static power-consumption (changing the HSF fan rpms changes overall power usage, for example), I plugged the HSF fans into the mobo header but physically set them to the side of the computer thus leaving the NH-D14 "fanless".

NH-D14SetupwithMovableFanDistance.jpg


To effect cooling of the NH-D14, I placed a large box-fan close to the NH-D14 and varied the distance between the bog fan and the cpu cooler

To conduct a data run I would set LinX to run (4 threads, affinity locked to physical cores), let the CPU warm up until the operating temperature was no longer changing, and recorded the temperature and power-consumption at the wall.

Then I would move the box-fan just a little bit farther away from the NH-D14, lowering the cooling efficiency of the NH-D14, and waited for temperatures to equilibrate and recorded the results.

Rinse and repeat ad nauseum until the operating temperatures reached TJmax. Then I would cool the CPU all the way back down to the lowest I could get it, raise the Vcore a smidge, and start the whole cycle over again.

i7-3770kat32GHzPowerConsumption.png


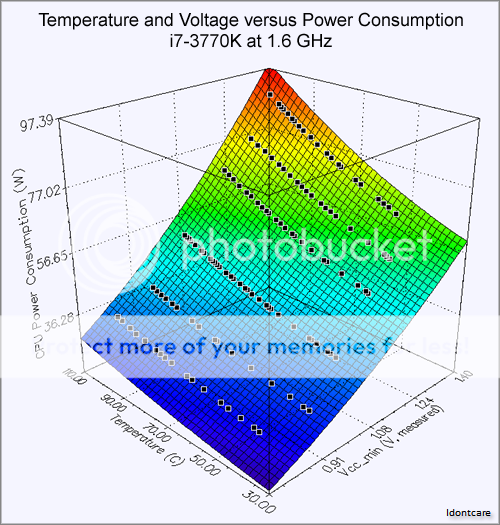
Thus I would generate power-consumption curves as a function of temperature at fixed voltages and fixed clockspeed, over and over again. Sweeping out a voltage space spanning ~0.8V to ~1.4V, a clockspeed space spanning 1.6GHz to 4.8GHz, and a temperature range spanning ~36°C to 105°C.

All told, for the 3770k cpu, I generated nearly 900 data points :eek: for power-consumption as a function of temperature, clockspeed, and voltage.

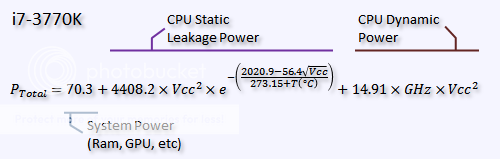
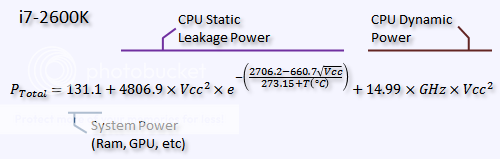
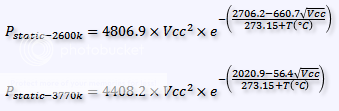
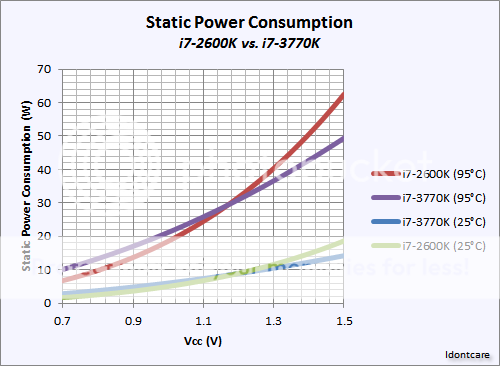
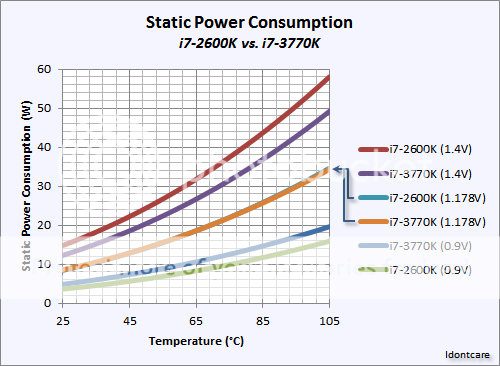
To analyze the results, the first step required feeding the data into Mathematica and fitting the data to the generalized power-consumption equation for CMOS IC's which we defined previously in the 2600k power-consumption thread:

PtotalVccTGHz.png


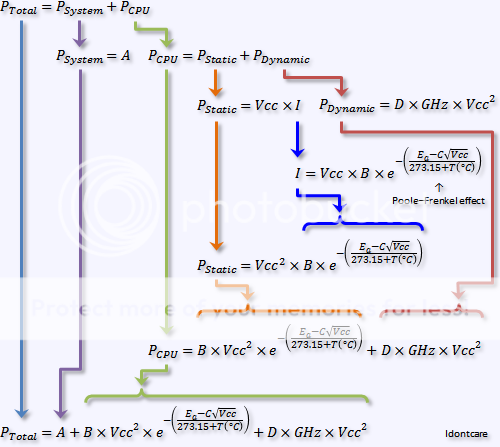
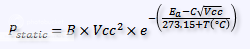
To capture the physics that are involved in temperature-induced leakage in CMOS ICs we rely on the Poole-Frenkel effect which adequately explains leakage current in insulating dielectric materials:

In solid-state physics, the Poole–Frenkel effect (also known as Frenkel-Poole emission[1]), is a means by which an electrical insulator can conduct electricity. It is named after Yakov Frenkel, who published on it in 1938,[2] and also after H. H. Poole (Horace Hewitt Poole, 1886-1962), Ireland.

The Poole–Frenkel effect describes how, in a large electric field, the electron doesn't need as much thermal energy to get into the conduction band (since part of this energy comes from being pulled by the electric field), so it does not need as large a thermal fluctuation and will be able to move more frequently.

Basically this all boils down to the following equation which is composed of three distinct portions - the platform's static power consumption (ram, video card, PSU inefficiency, etc), the static power consumption of the CPU (the temperature dependent part), and the dynamic power consumption of the CPU (the clockspeed dependent part).

PtotalVccTGHzSymbolicEquation.png


(...the 10 image maximum-per-post limit requires me to continue the discussion in next post)
 

Idontcare

Elite Member
Oct 10, 1999
21,118
58
91
Using this generalized power-consumption equation to fit the data (using Mathematica 8.0), it is difficult to show the data visually because it is four-dimensional (Clockspeed, Voltage, Temperature, Power-Consumption)...but I can show you in three dimensions what the function looks like, along with the data, when I hold one of those four variables constant (fixed clockspeed for example).

Behold the Wall of Graphs (WoG)!

TemperatureandVoltageversusPowerConsumption3770kat16GHz-1.png


TemperatureandVoltageversusPowerConsumption3770kat2GHz.png


TemperatureandVoltageversusPowerConsumption3770kat24GHz.png


TemperatureandVoltageversusPowerConsumption3770kat28GHz.png


TemperatureandVoltageversusPowerConsumption3770kat32GHz.png


TemperatureandVoltageversusPowerConsumption3770kat36GHz.png


TemperatureandVoltageversusPowerConsumption3770kat40GHz.png


Rolling all this data up into a single analytical expression we obtain the following equation:

i7-3770Ktotalpower.png


For comparison, here are the parameters obtained from similar analysis of the same hardware (same exact mobo, psu, ram, gpu, etc) with the 2600k plugged in:

i7-2600Ktotalpower.png


The discrepancy in "system power" is solely due to a driver change with the GTX460 that resulted in lower idle power-usage during the i7-3770k tests versus those of the i7-2600k tests. I did some spot-checks with the 2600k using the newer video drivers and was satisfied to observe that the shift in power consumption values were truly linear (thanks to a very flat power efficiency profile for my specific PSU) and since I am only interested in comparing static and dynamic cpu power usage between the 2600k and 3770k the shift in baseline power usage is easily accounted here and does not factor into the subsequent analyses.

So, looking at the static and dynamic power-usage parameters it is interesting to note that the dynamic power is almost identical for both CPU's. (the activity factor and capacitance value is essentially the same, ~15, for both cpus)

As far as dynamic power is concerned, the difference between the fancy 22nm 3D xtors and the 32nm planar HKMG xtors is simply a matter of the operating voltage necessary to hit any given clockspeed during the tests.

Static leakage does show markedly differing parameters between the two process node technologies, as expected considering the physically disparate topologies that each xtor profile physically represents, but what was perhaps even more intriguing is that at the end of the day the 22nm 3D xtor leakage results were pretty much indistinguishable from that of the 32nm xtor leakage results once you accounted for the voltage reduction.

Comparing the dynamic:static power consumption per processor as a function of clockspeed (which means temperature is not constrained, resulting on the ratio peaking and then rolling over at higher clockspeeds) we see that the 22nm 3D xtors brought with them a higher clockspeed before the curve peaked but the overall peak value itself remained essentially unchanged at 6:1.

DynamicvsStaticPowerConsumption.png


^ Curve shifted to the right from 3.2GHz for 32nm SB to 3.8GHz for 22nm IB.

(...the 10 image maximum-per-post limit requires me to continue the discussion in next post)
 

Idontcare

Elite Member
Oct 10, 1999
21,118
58
91
The 22nm 3D xtors in the 3770k result on much lower operating voltages required for stable operation at any given clockspeed compared to the 32nm xtors that power the 2600k.

The lower operating voltage in turn results in lower power consumption, but not lower operating temperatures (despite being delidded).

StaticversusDynamicfor2600kan3770k.png


32nm SB has a higher dynamic:static ratio at lower clockspeeds relative to IB because the operating temperatures for 22nm IB are just so much higher than those of 32nm SB, raising the static leakage of the 3770k such that the ratio itself is markedly lowered despite operating at a substantially lower power-consumption level overall.

ClockspeedversusPowerConsumptionfor2600kan3770k.png


^ At the device level, the underlying process node tech for 22nm appears to deliver a 28% reduction in overall CPU power consumption at the same clockspeed or enables a 14% increase in clockspeed for the same power-consumption over that of 32nm process node when comparing 32nm 2600k to 22nm 3770k.

Those graphs are bit difficult to digest and absorb simply because there is so much data going into them, here is a simpler graph just highlighting the basic power-consumption differences observed at a few specific clockspeeds:

CPUPowerConsumption.png


Here is a graph comparing the minimum voltage required for stable operation (passing at least 5 cycles of LinX) between the two processors:

ClockspeedversusMinimumVcc.png


^ notice that the voltage benefit for the 22nm 3D xtors starts to evaporate at higher clockspeeds, just as Intel indicated would be the case back when they first divulged the details on their 3D xtors, but at lower clockspeeds there is a sizable reduction in the voltage needed to operate the CPU despite the temperatures being nearly the same between the two processors at any given clockspeed:

ClockspeedversusMaximumTemperature.png


^ despite the lower operating voltage and the 3770k being delidded/relidded with NT-H1 CPU TIM and cooled with an H100, the temperature profiles for the 3770k is nearly the same as that for the 2600k when running IBT/LinX.
 

NTMBK

Lifer
Nov 14, 2011
10,232
5,012
136
Whenever someone like you drops a massive, well researched knowledge-bomb like this on the forum, I always picture you having an expression like this:

nvidia_tablet_jen.jpg


...and now I will go back and actually try to absorb that post. :D
 

SunnyD

Belgian Waffler
Jan 2, 2001
32,674
145
106
www.neftastic.com
^ despite the lower operating voltage and the 3770k being delidded/relidded with NT-H1 CPU TIM and cooled with an H100, the temperature profiles for the 3770k is nearly the same as that for the 2600k when running IBT/LinX.

Probably has something to do with the difference in die size/density and unit of power/dissipation per mm^2.

For the lay people, if you were to take a 3770k and "stretch it out" to the same physical die size as a 2600k, it would probably run (according to the numbers) something like 28% cooler than the 2600k, all other things being equal. Or something.

Highfive for IDC. Nicely done.
 
Last edited:

SithSolo1

Diamond Member
Mar 19, 2001
7,740
11
81
Amazing post once again but sadly I still lack the skill to fully comprehend it.
 

TuxDave

Lifer
Oct 8, 2002
10,572
3
71
Great analysis. There are some things that I consider a "surprise" in terms of your process node characteristics that I wouldn't have guessed (I never did any of the math to confirm) that will probably keep me occupied during my lunch break. For example leakage, I tried Googling for public information and I guess there's no disclosure on total transistor width. At least that way you can normalize your dynamic power/static power on a per Z of transistors basis to account for design changes.
 

Ferzerp

Diamond Member
Oct 12, 1999
6,438
107
106
The clockspeed vs power consumption suggests something slightly disturbing to me.

The sample size is small obviously, but your curves are going to cross sometime before 5.5Ghz.
 

GreenChile

Member
Sep 4, 2007
190
0
0
What if you normalized your data to account for the 20% increase in transistor count? That should give you an idea of how efficient the 22nm transistors are in comparison to 32nm transistors.

Great job!
 

Yuriman

Diamond Member
Jun 25, 2004
5,530
141
106
What if you normalized your data to account for the 20% increase in transistor count? That should give you an idea of how efficient the 22nm transistors are in comparison to 32nm transistors.

Great job!

Good idea, though I think it's more complex than appears at first glance. How many of those extra transistors are in the GPU?

IDC, one thing to consider is, are your two chips a good representation of Sandy Bridge and Ivy Bridge in general? For instance, my 3570K requires close to 0.075v more than yours for stability at the same clockspeeds (at least in the 4.4ghz+ range).
 

pelov

Diamond Member
Dec 6, 2011
3,510
6
0
IDC, one thing to consider is, are your two chips a good representation of Sandy Bridge and Ivy Bridge in general? For instance, my 3570K requires close to 0.075v more than yours for stability at the same clockspeeds (at least in the 4.4ghz+ range).

It's always going to vary a bit -- golden chip rule and all -- but it's nevertheless a pretty good indication.

Awesome work, btw :)
 

wand3r3r

Diamond Member
May 16, 2008
3,180
0
0
Wow, an engineer at work/play. Interesting how the 2 generations perform very similarly despite the (architecture, process node) differences.

The analysis is there, have you formed a conclusion?
 

GreenChile

Member
Sep 4, 2007
190
0
0
Wow, an engineer at work/play. Interesting how the 2 generations perform very similarly despite the (architecture, process node) differences.

The analysis is there, have you formed a conclusion?

Perhaps you missed the 'Clockspeed versus Power-Consumption' graph? I think that demonstrates how the two generations perform quite differently.

Also, I believe that was part of the conclusion.
 

NTMBK

Lifer
Nov 14, 2011
10,232
5,012
136
Interesting that there is such a wide band (~1.7GHz to ~4.6GHz, eyeballing it?) in which IB gives a lower temperature than SB, but that band tails off so abruptly when hitting the kind of speeds that serious overclockers are looking for.

In your opinion, how much of the difference in characteristics is down to the 22nm Xtors, and how much is due to architectural differences? Given that IB gave a modest performance bump clock for clock, and also featured larger on-die graphics, what effect would that have had on these results?
 

pelov

Diamond Member
Dec 6, 2011
3,510
6
0
Interesting that there is such a wide band (~1.7GHz to ~4.6GHz, eyeballing it?) in which IB gives a lower temperature than SB, but that band tails off so abruptly when hitting the kind of speeds that serious overclockers are looking for.

In your opinion, how much of the difference in characteristics is down to the 22nm Xtors, and how much is due to architectural differences? Given that IB gave a modest performance bump clock for clock, and also featured larger on-die graphics, what effect would that have had on these results?

More dark silicon would imply lower temperatures, but that's assuming he left the on-die graphics alone and didn't stress them.

The difference in temperature is due to the 22nm Tri-Gate transistors. The architectural changes were very minimal outside of the GPU
 

TuxDave

Lifer
Oct 8, 2002
10,572
3
71
More dark silicon would imply lower temperatures, but that's assuming he left the on-die graphics alone and didn't stress them.

The difference in temperature is due to the 22nm Tri-Gate transistors. The architectural changes were very minimal outside of the GPU

"very minimal" would be super appropriate for Westmere but not Ivybridge. You can see a nice summary of core architectural changes here:

http://www.anandtech.com/show/4830/intels-ivy-bridge-architecture-exposed/2

Since the schedule for a tick is pretty rough, you don't get all the super drastic changes in architecture but there's still new power/perf mechanisms introduced.
 

oceanside

Member
Oct 10, 2011
50
0
0
Nice thread IDC, very informative. The exponential nature of Vcc /Clockspeed ratio of the 3D transistors vs. the nearly linear nature of the traditional transistors is something to watch for in Haswell. I think it's worth monitoring just to see how much they can improve the 3D FinFet process at the 22nm node. I'm sure your de-lidding efforts have influenced this particular graph as well.
 

podspi

Golden Member
Jan 11, 2011
1,965
71
91
Awesome IDC, thanks! :thumbsup:

Sometimes I wonder how you got/choose your nick though, it seems to be a bit of a misnomer :D
 

Idontcare

Elite Member
Oct 10, 1999
21,118
58
91
Regarding the comments expressed on the matter of sample size and variation within samples, etc - absolutely, all those concerns are very true and valid.

I am merely reporting my observations, combined with a set of conclusions that come with the caveat "assuming these two CPUs represent generalizable attributes that fall close to the median values of their respective parent distributions".

If either one of these specific cpu's that I have in my possession are not performing in a manner indicative of that of the parent distribution (i.e. most other people's cpus) then all my observations and conclusions continue to hold, albeit only for my cpu's, but the extension of these conclusions to that of the generalized case would then be null and void.

But surely we can all agree that this body of work is not intended to be good enough for government work, let alone good enough for industry or academia. It is merely the musings of a random dude on the internet who is armed with a kill-a-watt meter and an otherwise unnoteworthy ability to graph things in Excel ;)

So everyone can relax and just take stock of the fact you are all getting exactly what you paid for, and it ain't worth a penny more! :D

Interesting that there is such a wide band (~1.7GHz to ~4.6GHz, eyeballing it?) in which IB gives a lower temperature than SB, but that band tails off so abruptly when hitting the kind of speeds that serious overclockers are looking for.

In your opinion, how much of the difference in characteristics is down to the 22nm Xtors, and how much is due to architectural differences? Given that IB gave a modest performance bump clock for clock, and also featured larger on-die graphics, what effect would that have had on these results?

IMO the sharp divergence in what is an otherwise expected trend comes down to me pushing the chip right past the very edge of the targeted regime for the circuits to operate.

In other words I was right close to the point in which the chip was not going to operate at any higher clockspeed regardless how many volts I shoved into it, but as I shoved higher and higher volts into it then of course the temperatures were rocketing upwards from the static leakage and dynamic power dependence on Vcc and Temperature.

Speaking about static leakage, I prepared the following for my own amusement and exploration, figured I'd share them perchance one or two other people might find them as intriguing as I did :p

Going back to our original generalized equation describing the power-consumption of our system as measured at the wall:

PtotalVccTGHzSymbolicEquation.png


Breaking out the portion that is solely responsible for capturing the static power consumption (leakage) of the CPU:

StaticPowerEquation.png


Now remember the parameters in the above equation basically relate to activation energy (Ea) for promoting an electron into the conduction band of a dielectric material (resistance) and the effective lowering of that activation barrier because of the polarization effect caused the presence of the applied voltage (parameter "C").

The premultiplier parameter "B" can be thought of as essentially capturing the total surface area through which leakage is occurring for the active device.

StaticPowerEquation2600kand3770k.png


So what we see here is that the effective surface area for leakage has decreased (4800 vs 4400), the activation energy for leakage has also decreased (2700 vs 2000) and the field-effect enhancement has likewise decreased (660 vs 56).

What this means is that there appears to be less places for leakage to occur (makes sense considering things shrunk in size), and the activation barrier for leakage decreased (it is easier for leakage to happen, also makes sense considering things shrunk in size) but what is intriguing/unexpected is the near 100x reduction in the field-effect dependency.

Meaning that in my 2600k the voltage plays a much larger roll in enabling leakage than it does in my 3770k. Is this one of the ramifications of converting from 2D to 3D xtors? I don't know, haven't really thought it through fully to have formed an opinion or an expectation either way just yet.

StaticPowerConsumptionVccversusPower.png


What does surprise me is that we get very comparable static leakage curves for both chips at a given temperature and voltage. Mind you that the big difference here is, of course, that you get MUCH higher operating clocks with the 3770k versus the clockspeed of the 2600k at any given voltage.

One unexpected effect here was that at low voltages the 2600k has lower static power than the 3770k, a situation that reverse when you get above ~1.178V. That may not be all that surprising if we consider the e-field enhancement effects that are in play in terms of leakage between the more densely packed metal-1 lines for instance where volt-for-volt the electric field at any given voltage is going to be ~20% higher on the dielectric separating those M1 lines in the 3770k versus the electric field placed on the dielectric separating the M1 lines in the 2600k. Something to contemplate.

Looking at the same picture from a different angle, holding voltage constant but varying the temperature, we get the following:

StaticPowerConsumptionTempversusPower.png


Note that at 1.178V the static power leakage for both the 2600k and 3770k are essentially identical across all temperatures and as such the two lines are overlapping and you cannot make out the line for the 2600k (indicated by arrows on the graph).

This graph basically shows us why power gating has become so critical to the design of CPU's as we have come below 45nm process nodes. You can't avoid having all that power wasted when the chip is doing stuff but you certainly want to have a way of shutting it down entirely (not just lowering Vcc when at idle).

And again, I worry this gets lost in translation here, just because the 3770k displays comparable static leakage to the 2600k at the same Vcc doesn't mean the 3770k uses the same power as the 2600k when clocked to the same clockspeed.

For starters the voltage needed to operate at the same clockspeed is much lower for the 3770k versus the 2600k, that immediately makes the static leakage for the 3770k lower.

What amazes me, and this is the message I hope people absorb in reading this, what amazes me is that Intel was able to shrink the physical geometry of the the circuits themselves in going from 32nm to 22nm (xtor density goes up) and yet they managed to essentially keep the static leakage the same (roughly) at any given temperature and/or voltage as the much less dense (and less likely to leak) 32nm circuits.

I think most people in the industry expect static leakage to increase at every node (holding Vcc constant) simply for the sake that the electrical insulation between conductors is getting thinning in the process of shrinking the circuits.

Yet we see here that Intel managed to stave off that static leakage hit in nearly a one-to-one fashion with the 32nm->22nm shrink as far as I can tell. And that impresses the hell out this old process development engineer, you don't see that everyday (or ever, until now that is) :thumbsup:
 

Arkaign

Lifer
Oct 27, 2006
20,736
1,377
126
I love this, but it isn't apples to apples as delidded no warranty 3770k is in no way equal to stock 3770k.
 

Idontcare

Elite Member
Oct 10, 1999
21,118
58
91
I love this, but it isn't apples to apples as delidded no warranty 3770k is in no way equal to stock 3770k.

:confused: How so? Volts are volts and temps are temps.

All that delidding changes is the lowest temperature and lowest volts needed to be stable. Doesn't change the underlying device physics one iota.
 

Revolution 11

Senior member
Jun 2, 2011
952
79
91
Amazing post as usual, IDC. I have not even digested half of the information overload being presented.

Now my question is, can we continue to expect informative posts from you on Haswell and beyond? :D
 

Xpage

Senior member
Jun 22, 2005
459
15
81
www.riseofkingdoms.com
excellent posts IDC.

Wouldn't the surface area for static leakage increase since the finfet, increases the surface area around the drain? Also I am not sure how much the doping has changed in between 32nm and 22nm, which may be part of the static leakage non-increase.


I am surprised by the large drop in activation energy decrease ~30%. Granted the field-effect enhancement dropped significantly, thus the overall e^x value is approximately the same.

In future shrinks, it appears to me that the activation energy will drop even more and there won't be a large enough decrease in the field-effect enhancement to compensate thus there will be an increase in static power consumption in the 14nm shrink.

But then again I don't have an EE degree, just a biochemist who doesn't need to know much math so I am making assumptions for trends to occur to 14nm. It really does appear around 5-10nm will be a hard limit for CMOS shrinkage.

I would assume at that point static leakage will be a major issue and everything not in use will have to be voltage gated but they probably are nowadays anyway.
 

Ayah

Platinum Member
Jan 1, 2006
2,512
1
81
Awesome work! But the physicist in me says you neglected the propagation of errors. (sarcasm implied) But, technically, if the errors in measurement are significant, it could throw a serious wrench into possible conclusions drawn. (ie noise in particle physics is a bitch)