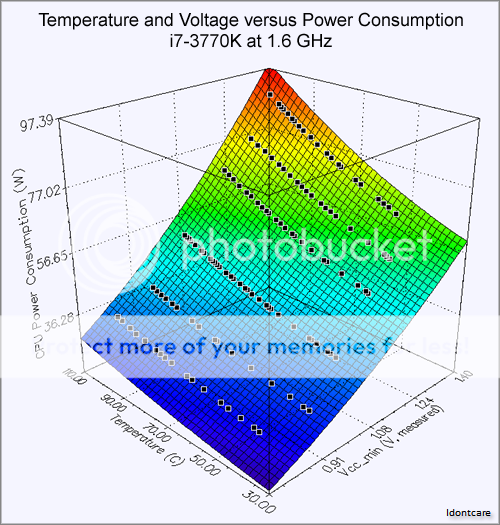
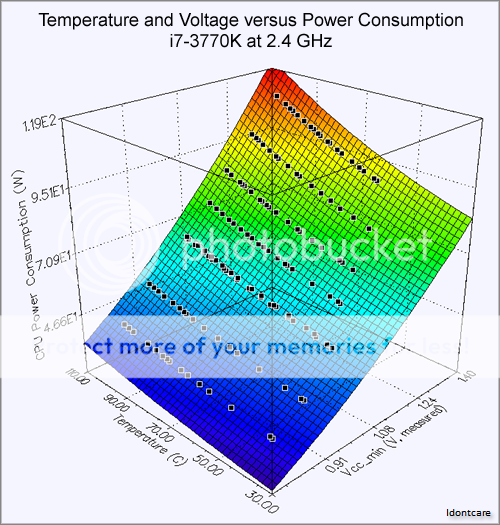
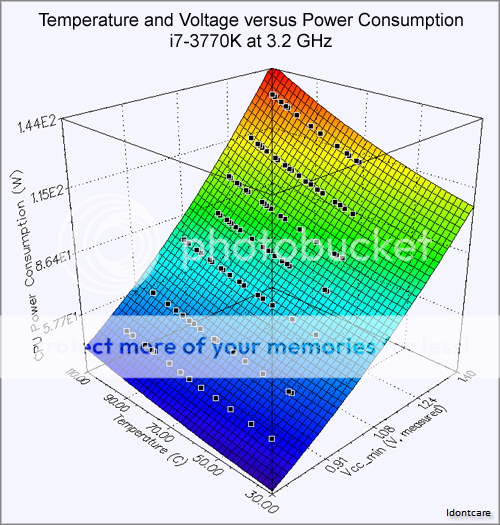
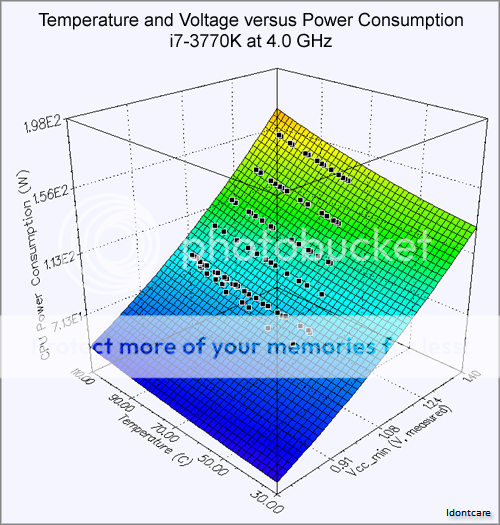
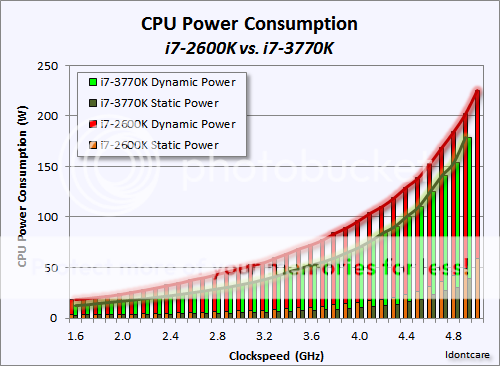
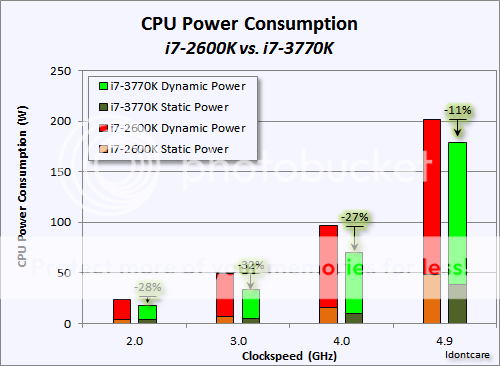
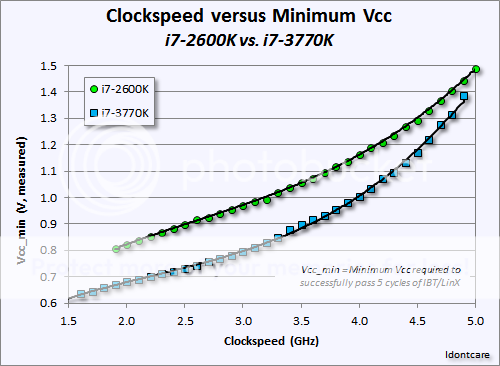
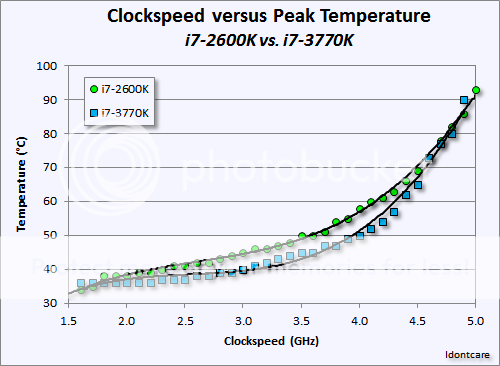
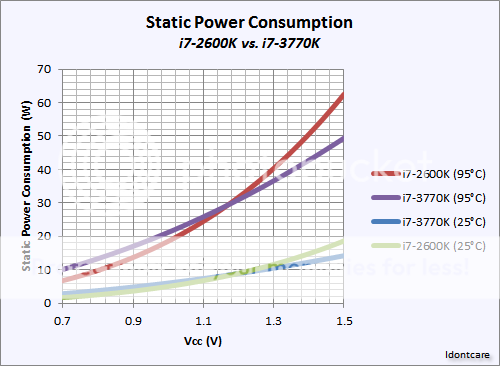
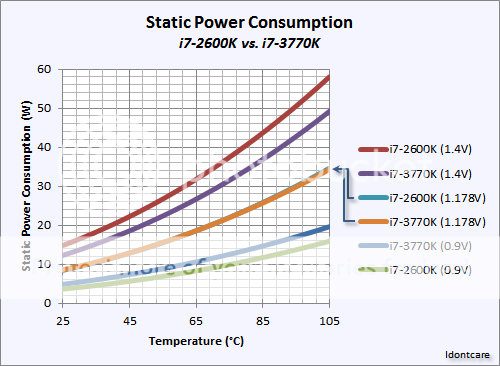
It has been just a little over a year now since I posted my deep-dive analysis of the dependence of power-consumption with temperature, clockspeed, and cpu voltage for my 32nm i7-2600K cpu (sandy bridge) and I felt like it would be a nice evolution to perform a similar analysis of my 22nm i7-3770K cpu (ivy bridge).
Now in order to generate data on the 3770k which would be more amenable to an apples-to-apples comparison with the 2600k (which was lapped, soldered, etc) I went to some efforts to improve on the baseline stock thermals of the IB chip. Those efforts included lapping the IHS as well as delidding the IHS and replacing the CPU TIM.
In the course of those efforts we learned that the stock CPU TIM itself is not the culprit behind the high operating temperatures of Ivy Bridge; rather, the primary culprit is the gap that exists between the CPU silicon die and the underside of the IHS (the gap being filled with TIM of course).
Eliminating that gap, or replacing the CPU TIM with a TIM that has thermal conductivity comparable to that of pure metal in the first place (as Intel accomplishes with their solder on 32nm Sandy Bridge, and as enthusiasts accomplish with metal-TIM substitutes such as Coollaboratory Liquid Ultra) results in dramatically lower operating temperatures for Ivy Bridge cpus when the clockspeeds get into the 4.5GHz territory and higher.
Armed with my delidded i7-3370K, my lapped H100 and NH-D14, and an Asus Maximus IV Extreme-Z (aka MIVE-Z), I spent the last month or so finding hours here and there to compile a bit of data which fleshes out the power-consumption profile for my 3770k as a function of CPU voltage, clockspeed, and operating temperature.
Hardware Setup and Configuration during Testing:

Just as was done in the analysis of the 2600k, power-consumption data was monitored "at the wall" with a kill-a-watt power monitor for the entire system (sans the LCD) and then an analysis is done to extract the platform power usage (including AC/DC power losses by the PSU itself) afterwards.

In order to have control over the operating temperature of the CPU without changing the platform's static power-consumption (changing the HSF fan rpms changes overall power usage, for example), I plugged the HSF fans into the mobo header but physically set them to the side of the computer thus leaving the NH-D14 "fanless".

To effect cooling of the NH-D14, I placed a large box-fan close to the NH-D14 and varied the distance between the bog fan and the cpu cooler
To conduct a data run I would set LinX to run (4 threads, affinity locked to physical cores), let the CPU warm up until the operating temperature was no longer changing, and recorded the temperature and power-consumption at the wall.
Then I would move the box-fan just a little bit farther away from the NH-D14, lowering the cooling efficiency of the NH-D14, and waited for temperatures to equilibrate and recorded the results.
Rinse and repeat ad nauseum until the operating temperatures reached TJmax. Then I would cool the CPU all the way back down to the lowest I could get it, raise the Vcore a smidge, and start the whole cycle over again.

Thus I would generate power-consumption curves as a function of temperature at fixed voltages and fixed clockspeed, over and over again. Sweeping out a voltage space spanning ~0.8V to ~1.4V, a clockspeed space spanning 1.6GHz to 4.8GHz, and a temperature range spanning ~36°C to 105°C.
All told, for the 3770k cpu, I generated nearly 900 data points for power-consumption as a function of temperature, clockspeed, and voltage.
To analyze the results, the first step required feeding the data into Mathematica and fitting the data to the generalized power-consumption equation for CMOS IC's which we defined previously in the 2600k power-consumption thread:

To capture the physics that are involved in temperature-induced leakage in CMOS ICs we rely on the Poole-Frenkel effect which adequately explains leakage current in insulating dielectric materials:
Basically this all boils down to the following equation which is composed of three distinct portions - the platform's static power consumption (ram, video card, PSU inefficiency, etc), the static power consumption of the CPU (the temperature dependent part), and the dynamic power consumption of the CPU (the clockspeed dependent part).

(...the 10 image maximum-per-post limit requires me to continue the discussion in next post)
Now in order to generate data on the 3770k which would be more amenable to an apples-to-apples comparison with the 2600k (which was lapped, soldered, etc) I went to some efforts to improve on the baseline stock thermals of the IB chip. Those efforts included lapping the IHS as well as delidding the IHS and replacing the CPU TIM.
In the course of those efforts we learned that the stock CPU TIM itself is not the culprit behind the high operating temperatures of Ivy Bridge; rather, the primary culprit is the gap that exists between the CPU silicon die and the underside of the IHS (the gap being filled with TIM of course).
Eliminating that gap, or replacing the CPU TIM with a TIM that has thermal conductivity comparable to that of pure metal in the first place (as Intel accomplishes with their solder on 32nm Sandy Bridge, and as enthusiasts accomplish with metal-TIM substitutes such as Coollaboratory Liquid Ultra) results in dramatically lower operating temperatures for Ivy Bridge cpus when the clockspeeds get into the 4.5GHz territory and higher.
Armed with my delidded i7-3370K, my lapped H100 and NH-D14, and an Asus Maximus IV Extreme-Z (aka MIVE-Z), I spent the last month or so finding hours here and there to compile a bit of data which fleshes out the power-consumption profile for my 3770k as a function of CPU voltage, clockspeed, and operating temperature.
Hardware Setup and Configuration during Testing:
- Mobo: ASUS Maximus IV Extreme-Z (3402 bios rev)
- CPU: i7-2600K (lapped to 3000 grit) and i7-3770k (lapped to 3000 grit, delidded and CPU TIM replaced with NT-H1)
- Ram: 16GB (4x4GB) G.SKILL Ripjaws X Series DDR3-2133 Model F3-17000CL11Q-16GBXL (configured to run at DDR3-1866 1.5V 10-10-10-28-T1)
- SSD OCZ Vertex 3 VTX3-25SAT3-240G 240GB
- GPU: MSI N460GTX CYCLONE GTX 460 at 900MHz/1.1V (delidded, cooled with Artic Cooling Accelero XTREME Plus)
- PSU: CORSAIR Professional Series Gold AX850 (CMPSU-850AX)
- HSF: Corsair H100 and Noctua NH-D14 (both lapped to 3000 grit)
- OS: Win7 x64 Ultimate

Just as was done in the analysis of the 2600k, power-consumption data was monitored "at the wall" with a kill-a-watt power monitor for the entire system (sans the LCD) and then an analysis is done to extract the platform power usage (including AC/DC power losses by the PSU itself) afterwards.

In order to have control over the operating temperature of the CPU without changing the platform's static power-consumption (changing the HSF fan rpms changes overall power usage, for example), I plugged the HSF fans into the mobo header but physically set them to the side of the computer thus leaving the NH-D14 "fanless".

To effect cooling of the NH-D14, I placed a large box-fan close to the NH-D14 and varied the distance between the bog fan and the cpu cooler
To conduct a data run I would set LinX to run (4 threads, affinity locked to physical cores), let the CPU warm up until the operating temperature was no longer changing, and recorded the temperature and power-consumption at the wall.
Then I would move the box-fan just a little bit farther away from the NH-D14, lowering the cooling efficiency of the NH-D14, and waited for temperatures to equilibrate and recorded the results.
Rinse and repeat ad nauseum until the operating temperatures reached TJmax. Then I would cool the CPU all the way back down to the lowest I could get it, raise the Vcore a smidge, and start the whole cycle over again.

Thus I would generate power-consumption curves as a function of temperature at fixed voltages and fixed clockspeed, over and over again. Sweeping out a voltage space spanning ~0.8V to ~1.4V, a clockspeed space spanning 1.6GHz to 4.8GHz, and a temperature range spanning ~36°C to 105°C.
All told, for the 3770k cpu, I generated nearly 900 data points
To analyze the results, the first step required feeding the data into Mathematica and fitting the data to the generalized power-consumption equation for CMOS IC's which we defined previously in the 2600k power-consumption thread:

To capture the physics that are involved in temperature-induced leakage in CMOS ICs we rely on the Poole-Frenkel effect which adequately explains leakage current in insulating dielectric materials:
In solid-state physics, the PooleFrenkel effect (also known as Frenkel-Poole emission[1]), is a means by which an electrical insulator can conduct electricity. It is named after Yakov Frenkel, who published on it in 1938,[2] and also after H. H. Poole (Horace Hewitt Poole, 1886-1962), Ireland.
The PooleFrenkel effect describes how, in a large electric field, the electron doesn't need as much thermal energy to get into the conduction band (since part of this energy comes from being pulled by the electric field), so it does not need as large a thermal fluctuation and will be able to move more frequently.
Basically this all boils down to the following equation which is composed of three distinct portions - the platform's static power consumption (ram, video card, PSU inefficiency, etc), the static power consumption of the CPU (the temperature dependent part), and the dynamic power consumption of the CPU (the clockspeed dependent part).

(...the 10 image maximum-per-post limit requires me to continue the discussion in next post)


