Like I said, it depends on the game and many times even the scene you are testing in the game. A lot of reviewers will test scenes with very few characters and almost nothing happening. They do this for repeatability but then it raises the question if the test reflects actual play through performance.
Having recently reviewed the Ryzen 5 1600 AF, you should know all there is to know about this nimble CPU. In short, it's an incredible value for...

www.techspot.com
I just went ahead and tossed TechSpot's data -- not from this review, but from their 10900K and 3100/3300X review (which includes same system setup for all systems) into Excel and used the Data Analysis add in for some basic evaluation.
Setup
Independent variables were cores, threads, base freq, boost freq.
Dependent variables were average FPS, 1% lows, and what I call "delta%".
Delta% is the gap between average FPS and 1% lows, represented as a percentage - 1% lows divided by average FPS. The higher this percentage, the closer the 1% lows are to the average FPS, and the "smoother" the game would likely be.
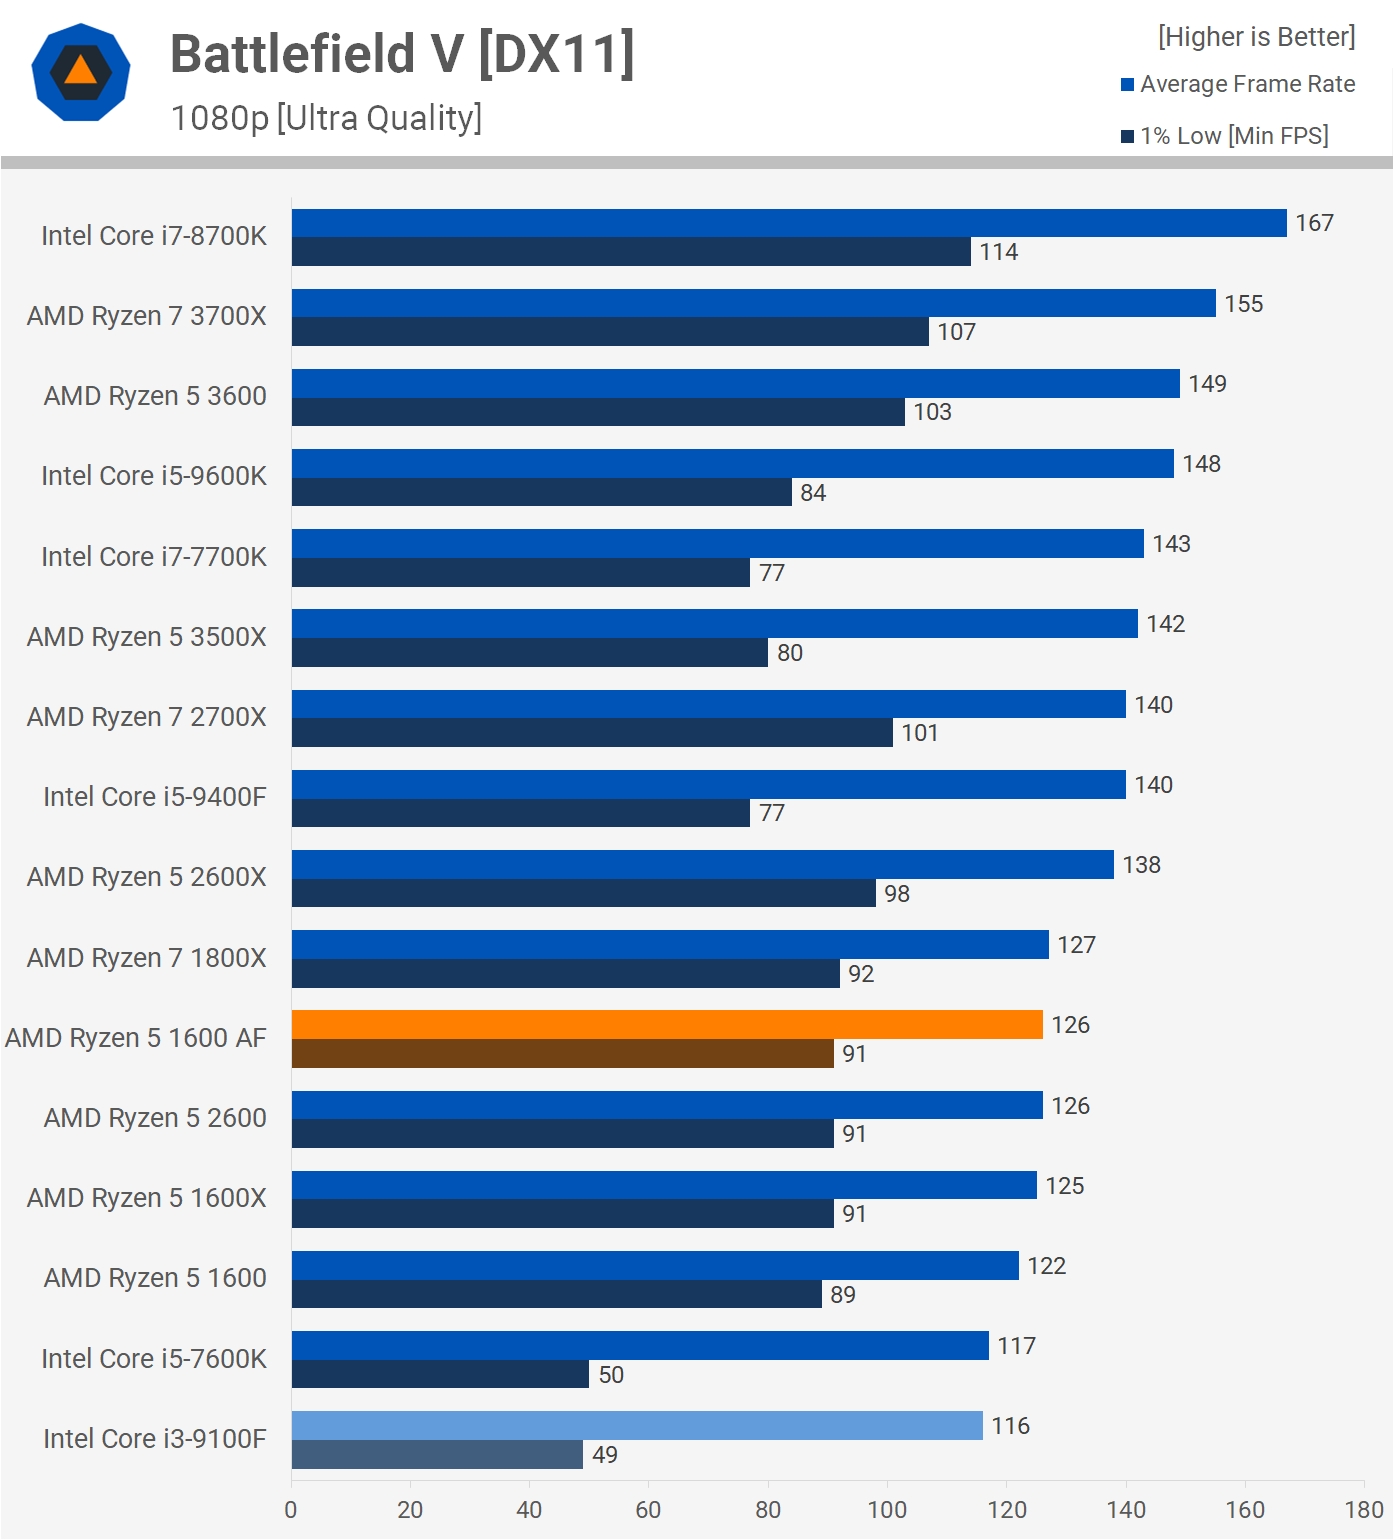
Results were from Battlefield V on Techspot's reviews listed above.
CPUs looked at were AMD's current Zen2 desktop lineup (except 3500X, 3600X, 3800X) and Intel's 9100F, 9400F, 9700K, 9900K, 10900K, 8700K, 7700K, as well as the 1600, 1600AF, 2600, 2700X. Thus, a broad range of cores, threads, base clocks, boost clocks.
(Could be easily done on multiple of TechSpot's reviewed games too.)
Results
Correlations
The strongest correlation with 1% lows was boost speed, and that Pearson r value was 0.794, the highest correlation of ANY of the values except for average FPS and boost speed, which was 0.908 Pearson r.
For delta%, if you want to minimize the gap between the 1% lows and average FPS for smoother gameplay, the tightest correlation is thread count, but cores, boost clock saw similar correlations -- overall -- Pearson r of 0.597 for threads, 0.522 for cores, 0.510 for boost clock.
Of course, many of the higher-core, higher-thread chips have faster boost clocks. So how does one disentangle whether the higher delta% is due to higher thread counts, core counts, or boost clocks? We have to run a regression analysis to determine which factor is actually contributing to the high 1% lows and good delta%.
Regression
First I standardized the continuous independent variables. Then I checked coefficients for 1% lows and delta%.
As it turns out, the coefficient for boost clock is the best predictor with a coefficient of 0.373, and the thread count is next best, but quite weak in comparison, with a coefficient of 0.056. Cores and base clock exhibit negative coefficients. This tells us it's likely that the strong correlation between thread count and delta% was actually substantially contributed by the higher boost clocks seen on these highly-threaded chips.
However, it should be noted, even using cores, threads, base, and boost, the best R2 is 0.558, which isn't all that great, and while boost clock is the largest contributor to that, none of these variables are great predictors of a good delta% score, even when combined.
(Even if you just want to look at pure 1% lows, the coefficient for boost clocks is 123.78, and that for thread count is 8.32, with cores and base clock having negative coefficients; that R2 fit is better at 0.739.)
Conclusion
Boost clock carries a moderate coefficient of determination in relation to high delta% and high 1% lows. But the number of cores and threads, based on this data, plays a minimal role when you analyze the data to disentangle multiple possible contributing factors.
Does the conclusion fit the individual data points? Yes. If threads were the primary factor, one would expect the 9700K (8 threads) to perform on par with a 7700K or 3300X which both have 8 threads. However, the 9700K performs between the 2700X/3700X and the 9900K/10900K. If threads were extremely important, one would expect the delta% leaders to be the 3900X and 3950X, but they sit alongside the 3600 and 9700K with respect to delta%.
On the other hand, if cores were of primary importance, then the 3300X should sit behind the 1600AF, 2600, 9400F -- but in fact it sits ahead of them.
For most of these conundrums, the answer lay in the boost frequency -- the 3300X boosts higher than the 1600AF, 2600, and 9400F. The 9700K boosts higher than all the chips except the two that sit ahead of them in the delta% rankings.
Overall, I think the data make sense. But of course, I'd like to see more data as well. And of course, we can talk a lot about whether Battlefield V's benchmark is taxing enough on the CPU as well. I am open to any other benchmarks that have been done that might expose weaknesses in low-thread-count CPUs.
(Caveat emptor: While I have worked on a lot of research projects, I did so with the assistance of statisticians, and my knowledge is based to a great extent on what I learned from them. I have taken stats classes, but nothing like what they were doing/taught me. Thus, my informal education I think is OK, but I would never run a real statistical analysis on a research project without a real statistician involved.)

 www.engadget.com