Effect of Temperature on Power-Consumption with the i7-2600K

Idontcare

Elite Member
Oct 10, 1999
21,118
58
91
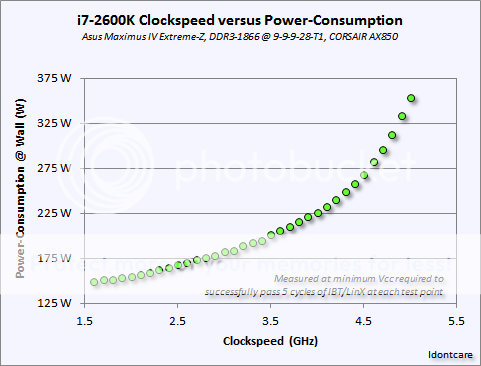
Building on a previous thread that was directed more towards power-consumption scaling with CPU clockspeed, of the many things uncovered in that thread the one thing that just never sat right with me, or with many other members, was the impact of the operating temperature on power-consumption itself was never fully, robustly, addressed.

So I went back and re-investigated the matter from top to bottom, and I figured I would share the results with all three of you out there who care to get into this stuff like I do :D ;)

Just to re-visit the hardware setup here, I've got an ASUS Maximus IV Extreme-Z that has these lovely ProbeIT voltage monitoring connections built right into the motherboard so I can track the CPU's Vcc in realtime with an external voltmeter.

DSCN0950.jpg


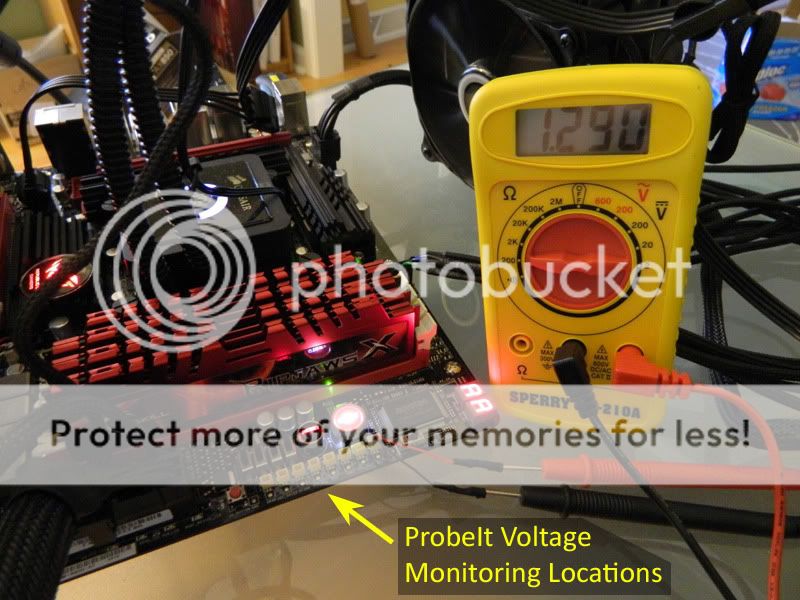
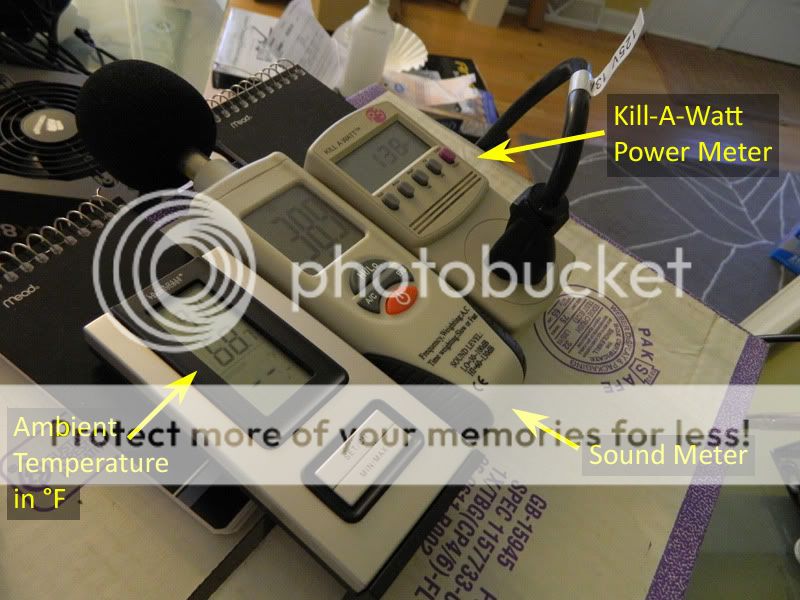
In addition to that "feature", I've got your standard run of the mill Kill-a-Watt power meter along with a generic ambient temperature probe.

DSCN0952.jpg


Now for the tests I wanted to run here, looking at the effect of temperature on power-consumption, I needed a way to control the temperature of the CPU without changing the power of the system when doing so (without changing the fan rpm's that were connected to the mobo for example).

To that end, what I did was I connected 4 fans to the motherboard headers (for power-draw continuity purposes) but I set the fans off to the side so they weren't actually being used to cool anything.

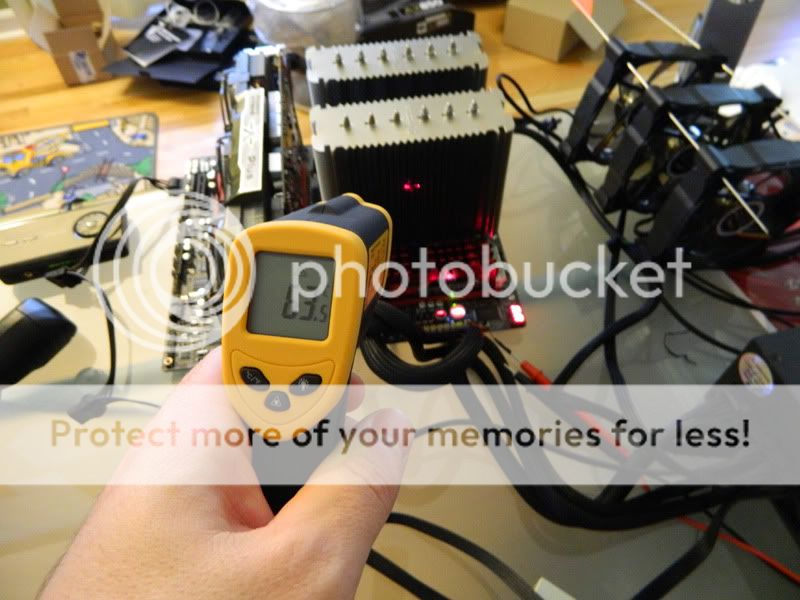
Then I setup an external box-fan, the kind you'd buy at Walmart or Home Depot, and used that to blow air across the computer and through the fins of the Noctua NH-D14 heatsink. (which was lapped, along with the CPU, details here if interested)

DSCN1066.jpg


^ The box-fan (not really a box-fan as you can see, but I forget the technical name for this thing) can be seen in the background there.

What I did to control the CPU temps was I started IBT for a silly long session (300 minutes) with the boxfan close to the NH-D14. Monitored temps with real-temp. Once the temps leveled off, with the computer fully loaded with IBT (4 threads, affinity locked to physical cores) I would physically move the box-fan a small distance away from the computer in increments of roughly 6-12 inches at a time.

Then I'd let the temperatures level off, I'd record the temperature and power-consumption, and move the fan again.

I would repeat this process until the CPU hit is TJmax of 98°C and started throttling.

In cases with low clockspeed and/or low Vcc, where the NH-D14 was actually sufficient to passively cool the CPU at a temperature under the TJmax limit, I would go to the extremes of putting a card-board box over the top of the NH-D14 to force the issue of getting the CPU to heat up:
DSCN1062.jpg


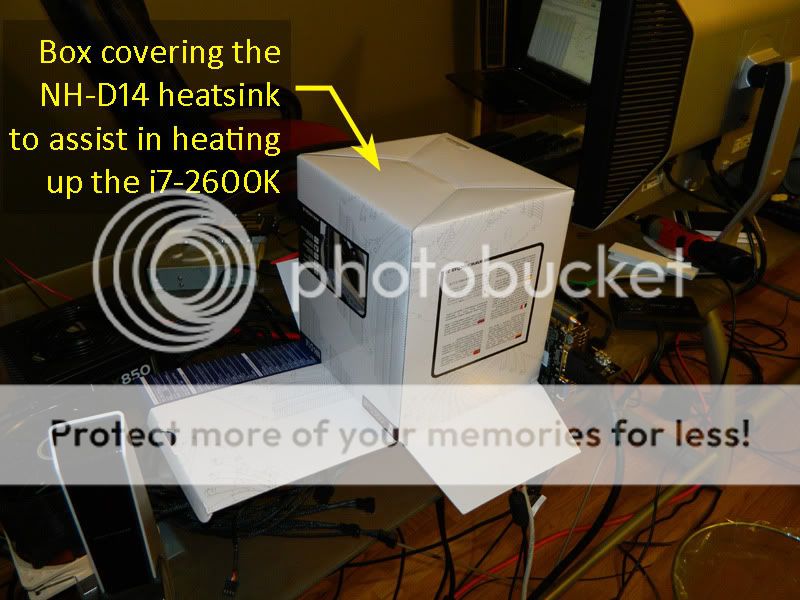
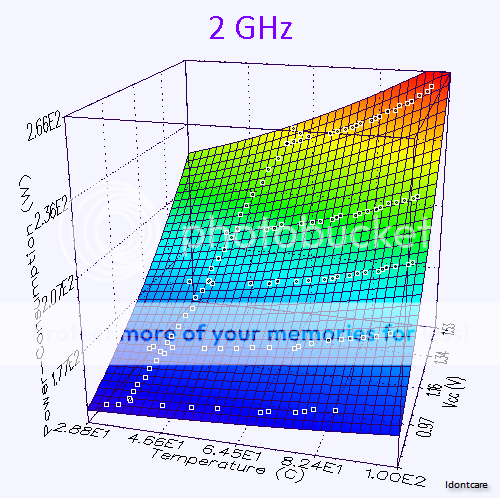
In the case of the 2600K operating at 2GHz and 0.820V, I simply could NOT get it to heat up to 98°C even with the box covering the NH-D14 and swaddling the whole thing with blankets to try and trap the heat :eek: (it maxed out around 86°C in that specific test)

And that's pretty much how I went about "acquiring the data".
 

Idontcare

Elite Member
Oct 10, 1999
21,118
58
91
Question: What does the CPU's operating temperature do to the power-consumption of your CPU/computer?

Answer:
TempvsPowerfor2GHzat1290V.png


Consider for a moment what this data are showing us. Keeping the voltage fixed at 1.290V (verified by multi-meter throughout the tests), keeping the clockspeed at 2Ghz, and merely allowing the operating temperature of the CPU itself to rise from 47°C to 96°C results in the CPU's power consumption increasing by 23W!

Here's another example, this time at 3GHz and 1.491V:
TempvsPowerfor3GHzat1491V.png


^ note the minimum temperature here is higher because of limitations of the cooling apparatus (NH-D14 in this case), but the moral of the story is the same, as the temperature rises the power-consumption itself rises dramatically, 30 Watts in this case.

The reason why the power-consumption is increasing with temperature has to do entirely with the static leakage power consumption of the CPU (it is independent of clockspeed, solely dependent on temperature and voltage) and a phenomenon known in physics as the Poole-Frenkel effect.

To adequately model the effect of temperature on power-consumption we use the following equations (math is broken out for benefit of the reader):

PtotalVccTGHz.png


We rely on the Poole-Frenkel effect to capture the physics behind the leakage in the insulator dielectric in the CPU:

In solid-state physics, the Poole–Frenkel effect (also known as Frenkel-Poole emission[1]), is a means by which an electrical insulator can conduct electricity. It is named after Yakov Frenkel, who published on it in 1938,[2] and also after H. H. Poole (Horace Hewitt Poole, 1886-1962), Ireland.

The Poole–Frenkel effect describes how, in a large electric field, the electron doesn't need as much thermal energy to get into the conduction band (since part of this energy comes from being pulled by the electric field), so it does not need as large a thermal fluctuation and will be able to move more frequently.

The material scientists in the crowd will recognize this as being the same basic idea behind FICs (fast ion conductors). It took me a while to realize that was what I needed to bring to bear here, and then it all fell into place from there.

PtotalVccTGHzSymbolicEquation.png


Using the generalized power-consumption equation to fit the data (using Mathematica 8.0), it is difficult to show the data visually because it is four-dimensional (Clockspeed, Voltage, Temperature, Power-Consumption)...but I can show you in three dimensions what the function looks like, along with the data, when I hold one of those four variables constant (fixed clockspeed for example).

Here's the data at 2GHz, varying the voltage and the temperature while measuring the resultant power-consumption:
PtotalVccTGHz2GhzSurfacePlot.png


Here's the same graph but representing the 3GHz data:
PtotalVccTGHz3GhzSurfacePlot.png


And 4GHz:
PtotalVccTGHz4GhzSurfacePlot.png


There's actually a lot more data to show here as I tested at every multiplier between 1.6GHz and 5.0GHz, but it is tedious to show all the results graphically so I hope these three examples will suffice to give you a feel for the data and the "goodness of fit" between them and the model equation given above.
 

Idontcare

Elite Member
Oct 10, 1999
21,118
58
91
Going back to my original quandary - "how do I model the power-consumption results of my i7-2600K as a function of clockspeed and voltage?" - we had the following data:

PtotalVccTGHzDataGraph.png


Now I did not use this data in the data set used with the curve fitting routines (post above this one) that resulted in the following parameters:

PtotalVccTGHzEquation.png


^ this equation does not come from "curve-fitting" the data shown in the graph above, but if we use this equation to plot a line on that same graph (overlay them) here is what we arrive at:

PtotalVccTGHzFitOverlayGraph.png


:eek: That's is a rather striking agreement between the model and the independent data set. :) (but getting there required us to robustly account for the effects of temperature on power-consumption)

To first-order, temperature only effects power-consumption in terms of static leakage. Of course temperature also effects dynamic power-consumption in terms of increasing resistance of the copper wires and so on, but the contributions from those terms are not meaningful in comparison to the magnitude of the impact that temperature has on power-consumption attributable to static leakage.

One last graph to share, this one showing the break-out between system power, static CPU power, and dynamic CPU power as a function of clockspeed (with the understanding that Vcc and operating temps are rising commensurate with clockspeeds as needed to ensure IBT stability at any given clockspeed):

PtotalVccTGHzAreaGraph.png


The minimum stable voltage for any given clockspeed looks like the following:
VoltageCurve.png


At 2.0GHz clocks, with the Vcc reduced to 0.822V (IBT stable), the 2600K consumes 24W at 38°C under load with IBT.

At 3.4GHz stock clocks, with the Vcc reduced to 1.038V (IBT stable), my 2600K consumes 65W at 48°C under load with IBT.

Pushing it up to 5.0GHz, with the Vcc set to 1.488V (IBT stable), this 2600K consumes 227W at 93°C under load with IBT.

According to the equations used here to describe power-consumption for this chip, theoretically if I could clock my chip to 6GHz while keeping the temps at 93°C the chip would need 2.05V and it would consume 541W during IBT.

Going to a more ludicrous extreme, 7GHz would require 2.94V and 1.4KW of juice :eek:
 
  • Like
Reactions: Arachnotronic

Idontcare

Elite Member
Oct 10, 1999
21,118
58
91
If anyone is curious to play around with the raw data themselves, here it is (all 300+ points worth o_O, that's a lot of IBT testing :D):
Code:
Clockspeed (GHz),Temperature (°C),Vcc (V),Power-Consumption (W)
1.6,58.0,1.496,220.0
1.6,44.0,1.169,173.0
1.6,38.0,0.973,157.0
1.6,34.0,0.803,149.0
1.7,59.0,1.495,224.0
1.7,45.0,1.168,176.0
1.7,39.0,0.973,159.0
1.7,35.0,0.802,151.0
1.8,60.0,1.495,228.0
1.8,46.0,1.168,179.0
1.8,40.0,0.973,161.0
1.8,38.0,0.802,151.0
1.9,61.0,1.495,232.0
1.9,46.0,1.168,181.0
1.9,41.0,0.973,163.0
1.9,38.0,0.807,153.0
2.0,62.0,1.495,237.0
2.0,47.0,1.168,183.0
2.0,41.0,0.973,164.0
2.0,38.0,0.820,156.0
2.0,38.0,0.845,157.0
2.0,38.0,0.870,158.0
2.0,39.0,0.895,159.0
2.0,39.0,0.920,161.0
2.0,40.0,0.945,163.0
2.0,40.0,0.970,165.0
2.0,41.0,0.995,167.0
2.0,41.0,1.020,168.0
2.0,42.0,1.045,171.0
2.0,43.0,1.070,174.0
2.0,44.0,1.095,176.0
2.0,44.0,1.120,179.0
2.0,45.0,1.145,181.0
2.0,46.0,1.170,184.0
2.0,46.0,1.194,188.0
2.0,47.0,1.219,191.0
2.0,48.0,1.244,194.0
2.0,49.0,1.269,198.0
2.0,50.0,1.294,201.0
2.0,50.0,1.319,206.0
2.0,51.0,1.344,209.0
2.0,52.0,1.369,213.0
2.0,54.0,1.394,218.0
2.0,55.0,1.418,223.0
2.0,57.0,1.443,227.0
2.0,59.0,1.468,233.0
2.0,60.0,1.493,239.0
2.0,32.0,0.820,152.0
2.0,35.0,0.820,153.0
2.0,46.0,0.820,155.0
2.0,53.0,0.820,156.0
2.0,59.0,0.820,157.0
2.0,69.0,0.820,158.0
2.0,71.0,0.820,159.0
2.0,77.0,0.820,160.0
2.0,79.0,0.820,161.0
2.0,81.0,0.820,162.0
2.0,86.0,0.820,163.0
2.0,37.0,0.976,165.0
2.0,38.0,0.976,166.0
2.0,43.0,0.976,167.0
2.0,51.0,0.976,168.0
2.0,55.0,0.976,169.0
2.0,59.0,0.976,170.0
2.0,63.0,0.976,171.0
2.0,67.0,0.976,172.0
2.0,73.0,0.976,173.0
2.0,74.0,0.976,174.0
2.0,77.0,0.976,176.0
2.0,81.0,0.976,178.0
2.0,84.0,0.976,179.0
2.0,86.0,0.976,180.0
2.0,89.0,0.976,181.0
2.0,92.0,0.976,182.0
2.0,95.0,0.976,184.0
2.0,41.0,1.164,183.0
2.0,46.0,1.164,184.0
2.0,57.0,1.164,185.0
2.0,62.0,1.164,186.0
2.0,64.0,1.164,187.0
2.0,69.0,1.164,188.0
2.0,72.0,1.164,189.0
2.0,76.0,1.164,190.0
2.0,78.0,1.164,191.0
2.0,79.0,1.164,192.0
2.0,82.0,1.164,193.0
2.0,84.0,1.164,194.0
2.0,86.0,1.164,195.0
2.0,89.0,1.164,196.0
2.0,90.0,1.164,197.0
2.0,91.0,1.164,198.0
2.0,93.0,1.164,199.0
2.0,96.0,1.164,200.0
2.0,97.0,1.164,201.0
2.0,47.0,1.290,199.0
2.0,50.0,1.290,201.0
2.0,58.0,1.290,202.0
2.0,60.0,1.290,203.0
2.0,62.0,1.290,205.0
2.0,67.0,1.290,206.0
2.0,70.0,1.290,207.0
2.0,72.0,1.290,208.0
2.0,75.0,1.290,209.0
2.0,76.0,1.290,210.0
2.0,77.0,1.290,211.0
2.0,81.0,1.290,212.0
2.0,82.0,1.290,213.0
2.0,84.0,1.290,214.0
2.0,86.0,1.290,215.0
2.0,87.0,1.290,216.0
2.0,89.0,1.290,218.0
2.0,91.0,1.290,219.0
2.0,93.0,1.290,220.0
2.0,95.0,1.290,221.0
2.0,96.0,1.290,222.0
2.0,58.0,1.493,232.0
2.0,60.0,1.494,233.0
2.0,62.0,1.494,234.0
2.0,64.0,1.494,236.0
2.0,70.0,1.494,238.0
2.0,72.0,1.494,239.0
2.0,74.0,1.494,240.0
2.0,76.0,1.494,241.0
2.0,77.0,1.494,242.0
2.0,78.0,1.494,243.0
2.0,81.0,1.494,245.0
2.0,82.0,1.494,246.0
2.0,83.0,1.494,247.0
2.0,85.0,1.494,249.0
2.0,87.0,1.494,250.0
2.0,88.0,1.494,252.0
2.0,90.0,1.494,253.0
2.0,91.0,1.494,254.0
2.0,93.0,1.494,257.0
2.0,95.0,1.494,259.0
2.0,96.0,1.494,261.0
2.0,38.0,0.822,155.0
2.1,63.0,1.494,241.0
2.1,47.0,1.166,185.0
2.1,41.0,0.973,166.0
2.1,39.0,0.837,157.0
2.2,64.0,1.494,245.0
2.2,48.0,1.166,188.0
2.2,42.0,0.972,168.0
2.2,39.0,0.851,159.0
2.3,65.0,1.494,249.0
2.3,48.0,1.166,191.0
2.3,42.0,0.972,169.0
2.3,40.0,0.866,162.0
2.4,66.0,1.494,253.0
2.4,49.0,1.166,193.0
2.4,42.0,0.972,170.0
2.4,41.0,0.881,165.0
2.5,67.0,1.493,257.0
2.5,50.0,1.165,195.0
2.5,43.0,0.972,172.0
2.5,41.0,0.896,168.0
2.6,69.0,1.493,262.0
2.6,50.0,1.165,197.0
2.6,44.0,0.972,174.0
2.6,42.0,0.915,170.0
2.7,70.0,1.493,265.0
2.7,51.0,1.165,199.0
2.7,44.0,0.971,176.0
2.7,42.0,0.925,173.0
2.8,71.0,1.492,269.0
2.8,52.0,1.165,201.0
2.8,45.0,0.970,178.0
2.8,43.0,0.940,176.0
2.9,73.0,1.492,273.0
2.9,52.0,1.165,204.0
2.9,45.0,0.970,180.0
2.9,44.0,0.956,178.0
3.0,73.0,1.492,277.0
3.0,52.0,1.165,206.0
3.0,45.0,0.970,181.0
3.0,43.0,0.966,182.0
3.0,44.0,0.986,185.0
3.0,44.0,1.006,187.0
3.0,45.0,1.026,190.0
3.0,46.0,1.046,192.0
3.0,47.0,1.066,194.0
3.0,47.0,1.086,196.0
3.0,48.0,1.106,199.0
3.0,48.0,1.125,202.0
3.0,48.0,1.145,205.0
3.0,49.0,1.165,208.0
3.0,50.0,1.185,211.0
3.0,51.0,1.205,214.0
3.0,52.0,1.225,218.0
3.0,53.0,1.245,221.0
3.0,54.0,1.264,225.0
3.0,56.0,1.284,229.0
3.0,57.0,1.304,233.0
3.0,58.0,1.324,237.0
3.0,59.0,1.344,241.0
3.0,60.0,1.364,245.0
3.0,62.0,1.383,250.0
3.0,62.0,1.403,255.0
3.0,63.0,1.423,260.0
3.0,65.0,1.443,265.0
3.0,67.0,1.462,270.0
3.0,68.0,1.482,275.0
3.0,39.0,0.972,177.0
3.0,41.0,0.972,178.0
3.0,42.0,0.972,179.0
3.0,43.0,0.972,180.0
3.0,57.0,0.972,181.0
3.0,62.0,0.972,182.0
3.0,65.0,0.972,183.0
3.0,67.0,0.972,184.0
3.0,72.0,0.972,185.0
3.0,76.0,0.972,186.0
3.0,82.0,0.972,188.0
3.0,85.0,0.972,189.0
3.0,88.0,0.972,190.0
3.0,93.0,0.972,191.0
3.0,94.0,0.972,192.0
3.0,97.0,0.972,193.0
3.0,47.0,1.164,207.0
3.0,57.0,1.164,208.0
3.0,62.0,1.164,210.0
3.0,69.0,1.164,211.0
3.0,73.0,1.164,213.0
3.0,76.0,1.164,214.0
3.0,81.0,1.164,216.0
3.0,85.0,1.164,218.0
3.0,86.0,1.164,219.0
3.0,90.0,1.164,220.0
3.0,91.0,1.164,221.0
3.0,93.0,1.164,222.0
3.0,94.0,1.164,223.0
3.0,95.0,1.164,224.0
3.0,67.0,1.491,270.0
3.0,69.0,1.491,271.0
3.0,71.0,1.491,272.0
3.0,72.0,1.491,273.0
3.0,74.0,1.491,274.0
3.0,75.0,1.491,277.0
3.0,78.0,1.491,278.0
3.0,80.0,1.491,281.0
3.0,84.0,1.491,284.0
3.0,86.0,1.491,285.0
3.0,87.0,1.491,286.0
3.0,89.0,1.491,287.0
3.0,93.0,1.491,292.0
3.0,95.0,1.491,294.0
3.0,97.0,1.491,295.0
3.0,45.0,0.969,182.0
3.1,74.0,1.492,280.0
3.1,53.0,1.164,208.0
3.1,46.0,0.984,184.0
3.2,75.0,1.492,284.0
3.2,53.0,1.164,210.0
3.2,46.0,0.994,189.0
3.3,77.0,1.491,289.0
3.3,53.0,1.164,212.0
3.3,47.0,1.018,192.0
3.4,78.0,1.491,293.0
3.4,54.0,1.164,214.0
3.4,48.0,1.038,195.0
3.5,79.0,1.491,297.0
3.5,55.0,1.164,216.0
3.5,50.0,1.058,201.0
3.6,80.0,1.491,301.0
3.6,56.0,1.164,218.0
3.6,50.0,1.073,206.0
3.7,81.0,1.491,304.0
3.7,56.0,1.163,221.0
3.7,51.0,1.093,210.0
3.8,82.0,1.490,310.0
3.8,57.0,1.163,222.0
3.8,54.0,1.118,216.0
3.9,83.0,1.490,314.0
3.9,58.0,1.163,224.0
3.9,55.0,1.138,221.0
4.0,84.0,1.490,318.0
4.0,59.0,1.163,227.0
4.0,58.0,1.165,226.0
4.0,58.0,1.173,228.0
4.0,59.0,1.183,230.0
4.0,59.0,1.193,232.0
4.0,60.0,1.203,234.0
4.0,61.0,1.213,237.0
4.0,62.0,1.223,239.0
4.0,62.0,1.233,241.0
4.0,62.0,1.243,244.0
4.0,63.0,1.253,245.0
4.0,64.0,1.262,247.0
4.0,64.0,1.272,249.0
4.0,65.0,1.282,252.0
4.0,66.0,1.292,254.0
4.0,66.0,1.302,258.0
4.0,67.0,1.312,259.0
4.0,68.0,1.322,262.0
4.0,68.0,1.332,264.0
4.0,69.0,1.342,267.0
4.0,70.0,1.352,269.0
4.0,70.0,1.362,272.0
4.0,71.0,1.372,275.0
4.0,72.0,1.382,278.0
4.0,73.0,1.392,280.0
4.0,74.0,1.402,283.0
4.0,75.0,1.412,287.0
4.0,76.0,1.421,290.0
4.0,77.0,1.431,294.0
4.0,78.0,1.441,297.0
4.0,78.0,1.451,301.0
4.0,79.0,1.461,304.0
4.0,80.0,1.471,308.0
4.0,81.0,1.481,312.0
4.0,82.0,1.490,317.0
4.0,58.0,1.162,226.0
4.1,85.0,1.489,323.0
4.1,59.0,1.163,229.0
4.1,60.0,1.188,232.0
4.2,86.0,1.489,327.0
4.2,61.0,1.209,240.0
4.3,87.0,1.489,331.0
4.3,63.0,1.236,249.0
4.4,88.0,1.489,335.0
4.4,66.0,1.267,258.0
4.5,89.0,1.489,338.0
4.5,69.0,1.290,268.0
4.6,90.0,1.488,342.0
4.6,73.0,1.330,282.0
4.7,91.0,1.488,347.0
4.7,78.0,1.369,296.0
4.8,92.0,1.488,352.0
4.8,82.0,1.405,312.0
4.9,93.0,1.488,355.0
4.9,86.0,1.444,334.0
5.0,94.0,1.487,359.0
5.0,93.0,1.488,354.0
 
  • Like
Reactions: Arachnotronic

drizek

Golden Member
Jul 7, 2005
1,410
0
71
I haven't read through all this yet, but... that's pretty cool.

Would it be accurate to generalize the Temp vs Power Consumption relationship as being linear, with a slope that increases along with VCore?
 

Idontcare

Elite Member
Oct 10, 1999
21,118
58
91
I haven't read through all this yet, but... that's pretty cool.

Would it be accurate to generalize the Temp vs Power Consumption relationship as being linear, with a slope that increases along with VCore?

It only looks linear because I zoomed way-in on those couple of regions.

It is exponential with respect to temperature, but definitely you could form an easy rule of thumb to treat it as linear because the worse that will come of such an approximation is that you'd be off by a watt or two (no big deal).

Before I came to the realization that I needed to include the Poole-Frenkel effect I was treating the temperature effect as a linear one and it wasn't all that bad.

I was just kinda blown away, I was not expecting the magnitude of the effect, when I saw the data.

Take for example the 2GHz chip at 1.290V and a cool 47°C, it consumes 68W. But let those temps rise from 47°C to 96°C and the power-consumption rises from 68W to 91W.

Consider that this 23W represents a 33% increase in power-consumption D: I just had no appreciation for how deleterious higher operating temps were for the power-consumption of the CPU.
 

Bill Brasky

Diamond Member
May 18, 2006
4,345
1
0
Interesting stuff here. I'm planning to finish reading the thread tomorrow with notebooks in mind. In a notebook, I wonder if the power required to spin a fan faster would offset the the power lost from leakage at higher temps. Admittedly, I'm not an engineer, so that could be a silly question. :p
 

drizek

Golden Member
Jul 7, 2005
1,410
0
71
Take for example the 2GHz chip at 1.290V and a cool 47°C, it consumes 68W. But let those temps rise from 47°C to 96°C and the power-consumption rises from 68W to 91W.

Consider that this 23W represents a 33% increase in power-consumption D: I just had no appreciation for how deleterious higher operating temps were for the power-consumption of the CPU.

I'd like to see this done on Bulldozer or Thuban. AMD says you shouldn't run them past something like 65C. I had read that Intel designs their CPUs to be able to tolerate higher temps in order to make them quieter and better for laptops (or, if you're being cynical, to save money on the HSF).

I'm curious if AMD's lower temp ceiling ends up helping them in performance/watt. I think Thuban is 62C whereas Sandy Bridge is 80C.
 

dma0991

Platinum Member
Mar 17, 2011
2,723
1
0
That is an awesome experiment. These graphs have more meaningful data than the tests that 99% of reviewers run. Anand should hire IDC to do their Ivy Bridge testing and review next year. :p
 

remyat

Member
Dec 31, 2010
43
0
61
I just love these "CSI: Idontcare" posts. :thumbsup:

Don't hate me but, if you are really bored, you could add two more variables? PSU efficiency and (I think it's a BIG "and") PSU efficiency dropping because higher PSU temps. Maybe they both negate themselves, don't know. Is there a way to easily measure power draw before getting to the PSU?

disclaimer: don't mind me if I'm saying something stupid because I got lost with the math from the last post. o_O
 

Idontcare

Elite Member
Oct 10, 1999
21,118
58
91
I just love these "CSI: Idontcare" posts. :thumbsup:

Don't hate me but, if you are really bored, you could add two more variables? PSU efficiency and (I think it's a BIG "and") PSU efficiency dropping because higher PSU temps. Maybe they both negate themselves, don't know. Is there a way to easily measure power draw before getting to the PSU?

disclaimer: don't mind me if I'm saying something stupid because I got lost with the math from the last post. o_O

The benefits of paying the piper for higher quality components is being leveraged here.

My PSU is the corsair gold ax850 (cmpsu-850ax) which has ~89% efficiency across much of the output range, and only varies by about 2% efficiency across the entire range:

ax850-efficiency.png

(^ that's Corsair's tech data there)

As you can see, we are looking at loads on my PSU that range from ~220W to ~380W, meaning the PSU efficiency is ranging from ~90% to ~91% across these tests.

The inefficiency of the PSU's AC/DC conversion is going to be absorbed into the "System Power" number - the 130W number - along with the ram, SSD, mobo chipset, and GPU.

The temps of these components was mostly held constant as the components are sitting on a bench and not enclosed in the case.

I did not include the data and photos here, but I periodically used a handheld IR gun to measure and monitor temps of various components throughout the days and weeks of tests here.

DSCN0979.jpg


^ the red dot you see on the NH-D14 finstack is from a built-in laser pointer on my IR gun, shows you exactly where you are sampling the blackbody radiation from for purposes of establishing thermal temperatures.

Also in this photo you can also catch a glimpse of the fan array of dummy fans I setup for power-consumption continuity purposes. The fans were normally placed on an adjacent platform below the desktop level during the tests. There is a fourth fan not shown in this photo, it was placed on top of the PSU to keep the PSU temps minimal while avoiding the PSU needing to kick-on its own internal cooling fan (which would have resulted in a non-linear power-consumption response for the system).

Its not perfect, but then again given the budget and the quality of the tools used (none of this is industrial/professional grade, this is more your weekend DIYer enthusiast type project) it's actually kinda surprising to me how decent the results were.

...so in order for me to run the tests you are proposing, I'd probably need a lower quality PSU that would give rise to more "interesting" results in terms of varying efficiency as a function of load and temperature.
 

Idontcare

Elite Member
Oct 10, 1999
21,118
58
91
^ I just had an idea of how to run a test to capture the loss of efficiency as a function of the PSU...I need to insulate it in a box along with a remote temperature probe and then monitor power at the wall while leaving everything else constant on the rig.

I'm going away on vacation for the next 9-10 days and will be away from keyboard, but when I get back I will run some of those tests.

How hot can I get my PSU and still be safe? (I don't want to irreversibly damage my PSU by getting it too hot)
 

remyat

Member
Dec 31, 2010
43
0
61
With that explanation I got what I wanted. I was thinking about PSU efficiency variation (AC/DC conversion and temperature) and it's influence in global power consumption, but you made it clear that it's pretty constant in your tests so, well done, I really enjoy your posts.
 

dma0991

Platinum Member
Mar 17, 2011
2,723
1
0
Most of the PSU overload tests that was done on HardwareSecrets have a limit of 50C +- 5C at most. That should be a safe boundary for the PSU testing.
 

Predicament

Junior Member
Oct 21, 2011
9
0
0
This is my first post on this forum though I have been lurking for a while. Truly impressive stuff - this data finding!

Great work :thumbsup:
 

thilanliyan

Lifer
Jun 21, 2005
11,848
2,051
126
Good job. Thorough as I would expect from you. :)

Those tests make me wanna get a 2600k lol...but I want moar pysical cores!!! :D

I have OCD about having "virtual cores" like HT or as it turns out CMT as well. :p
 

red454

Senior member
Oct 7, 2011
205
0
0
www.cardomain.com
Looks like a good liquid cooler for the (overclocked) CPU is a must.

I haven't fooled with overclocking (yet) but I wonder how much the CPU life is shortened when it is frequently exposed to high temps.
 

georgi984

Junior Member
Apr 7, 2010
10
0
0
nice info !
but make's me wonder if a 95W tdp CPU has ~~30W loss due to temp's
what's the massive GPU's loss will be just from different operating temperature's
 

Schmide

Diamond Member
Mar 7, 2002
5,581
712
126
I would think the rise in power is probably related to the voltage regulator circuit providing slightly more voltage to the CPU at higher temperatures. Especially if the voltmeter regulating that function is susceptible to erroneous results at high temperatures.

To truly confirm your results you would have to fully eliminate the VRMs from the heat effects.

Edit: NM I guess i glossed over you external reading of the voltage. Ehh sorry.
 
Last edited:

gevorg

Diamond Member
Nov 3, 2004
5,075
1
0
Another excellent analysis Idontcare! This should be front-page material for Anandtech!