OrangeKhrush
Senior member
@inf64
I see Juan has been bending the results a little.
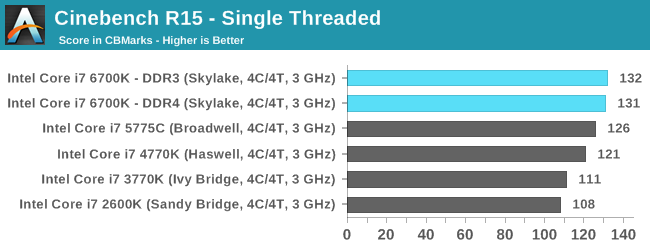
I don't agree with this graph at all, all those chips got a free point or two which doesn't agree with Cinebench at all.
2600K (3.4/3.8) 135 * 3 /3.8 = 106
3770K (3.5/3.9) 143 * 3 /3.9 = 110
4770K (3.5/3.9) 156 * 3/3.9 = 120
5775C (3.3/3.7) 157 * 3/3.7 = 127
6700K (4/4.2) 181 * 3/4.2 = 129
7700K (4/4.5) 193 * 3/4.5 = 128.66 (round off 129)
Zen (3.4) 134 * 3/3.4 = 118
So in reality
Zen vs Sandybridge = 1.12
12% higher is a huge miss on a prediction, that is well over margin of error. No Juan 12% is not Sandy = Zen bro, try another one.
I see Juan has been bending the results a little.
I will wait for reviews, but if that score is legit then my ancient
Zen IPC ~ Sandy Bridge IPC
has to be finally written like
RyZen IPC = 1.09 Sandy Bridge IPC
For the sake of comparison
Skylake IPC = 1.22 Sandy Bridge IPC
I don't agree with this graph at all, all those chips got a free point or two which doesn't agree with Cinebench at all.
2600K (3.4/3.8) 135 * 3 /3.8 = 106
3770K (3.5/3.9) 143 * 3 /3.9 = 110
4770K (3.5/3.9) 156 * 3/3.9 = 120
5775C (3.3/3.7) 157 * 3/3.7 = 127
6700K (4/4.2) 181 * 3/4.2 = 129
7700K (4/4.5) 193 * 3/4.5 = 128.66 (round off 129)
Zen (3.4) 134 * 3/3.4 = 118
So in reality
Zen vs Sandybridge = 1.12
12% higher is a huge miss on a prediction, that is well over margin of error. No Juan 12% is not Sandy = Zen bro, try another one.
Last edited: