
- Jan 10, 2019
- 3,331
- 5,282
- 136
According to anandtech.com the SPEC suit is the "Go To" bench for IPC testing, but as you can see they have OG Zen beat Skylake IPC, which at the time OG Zen was on par with Broadwell-E and just behind Skylake, They also show Excavator only 44% behind Zen which is about 52% ahead of Excavator in reality.
Here is the SPEC06/17 Chart.

Here is the CB R15 just for reference.
 www.guru3d.com

Another Chart

Also there were no IPC improvement from Skylake to Comet Lake.
Here is the SPEC06/17 Chart.
Here is the CB R15 just for reference.
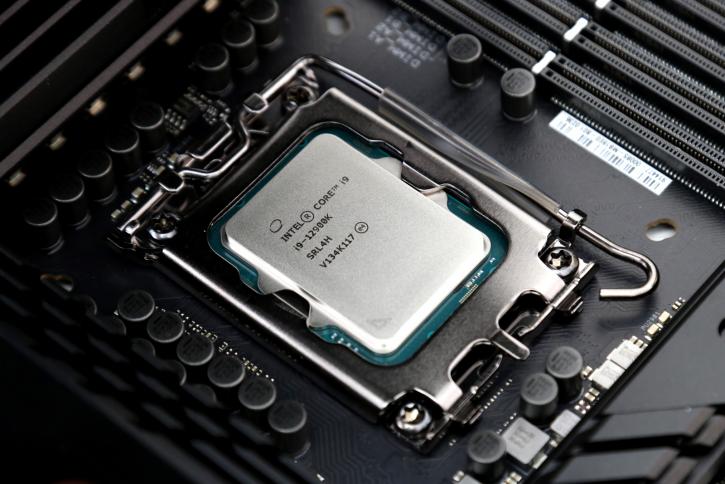
Core i9 12900K processor review (Page 7)
Meet Intel's new flagship CPU, the Core i9 12900K. It is based on the Alder Lake architecture and is reviewed here. This time around, Intel was back at the drawing board, creating a completely new ar...
www.guru3d.com
Another Chart
Also there were no IPC improvement from Skylake to Comet Lake.
Last edited:


