Power-Consumption Scaling with Clockspeed and Vcc for the i7-2600K

Idontcare

Elite Member
Oct 10, 1999
21,118
58
91
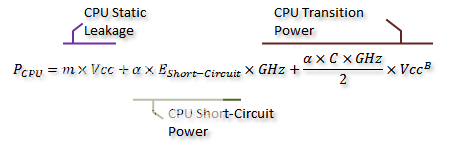
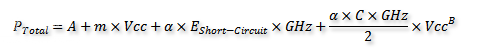
Since my asus maximus iv extreme-z has this nice convenient bank of voltage monitoring points (ASUS calls it "ProbeIt"), I thought I would have some geeky "sciency" fun armed with my i7-2600K, a volt-meter, a kill-a-watt power meter, and a garden variety rudimentary understanding of the analytical equations that express the power-consumption of my CPU as a function of clockspeed and operating voltage :p

Here's the ProbeIt voltage monitoring bank:
Intel&


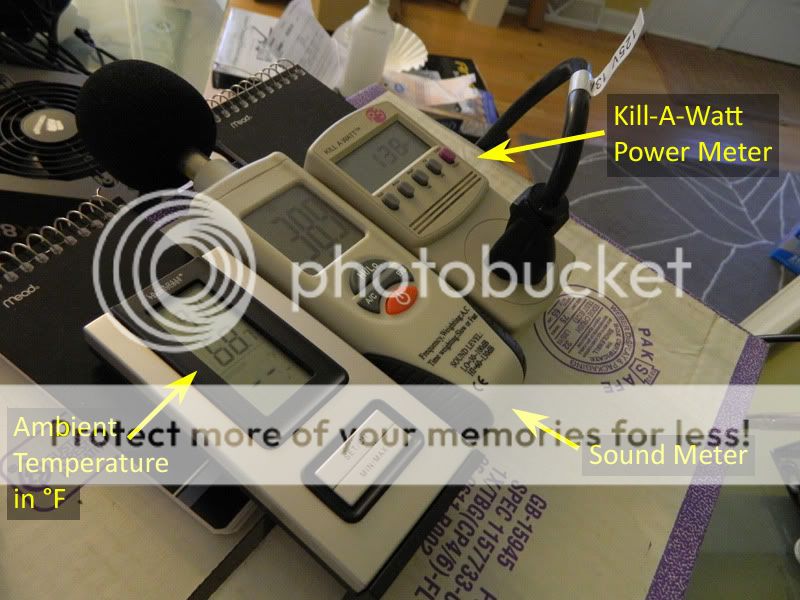
Kill-A-Watt setup (alongside a 30-100dB range sound meter and an ambient temperature probe):
DSCN0952.jpg


Armed with these data probes, I proceeded to test my 2600K at every multiplier value available from 16x to 50x (for these tests I did not go above 50x).

Some specs on the other hardware components - the rig is equipped with 4x4GB GSkill F3-17000CL11Q-16GBXL 1.5V rated at DDR3-2133 (but only running at DDR3-1866 10-10-10-28-T1 @ 1.5V), a delidded GTX460 905MHz/1.1V, a lapped 2600K and lapped H100 for cooling using NT-H1 TIM, powered by CORSAIR Gold AX850 (CMPSU-850AX) w/>90% efficiency.

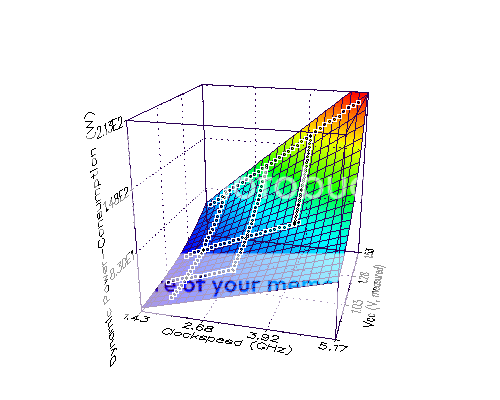
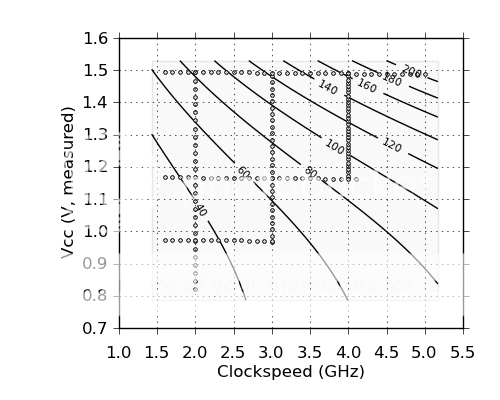
In the first set of tests, what I did was (1) select the CPU multiplier from within using TurboV EVO, (2) run LinX w/4-threads (affinity locked to physical cores) with 14.2GB of ram set to complete 5 passes.

If the CPU completes the run successfully (no errors detected, or BSOD's or reboots) then I take the voltage down by 0.005 V (the minimum step allowed with TurboV EVO) and do another run of 5 cycles in IBT.

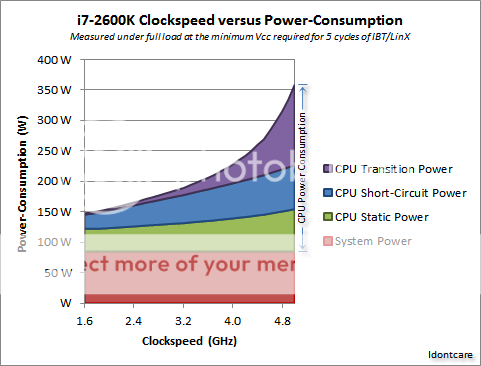
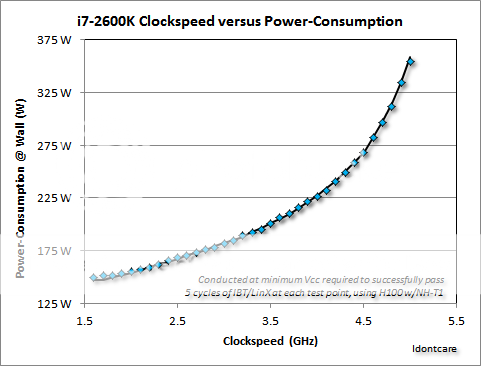
Once I found the minimum Vcc for which the CPU is stable enough to fully pass 5 cycles of IBT, I logged the peak temperature, peak power-consumption, ambient temperature, etc, and then incremented the multiplier and repeated the process all over again.

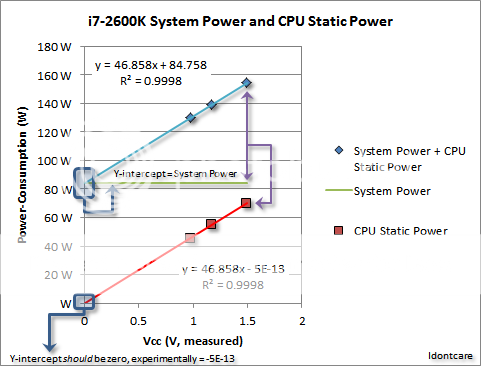
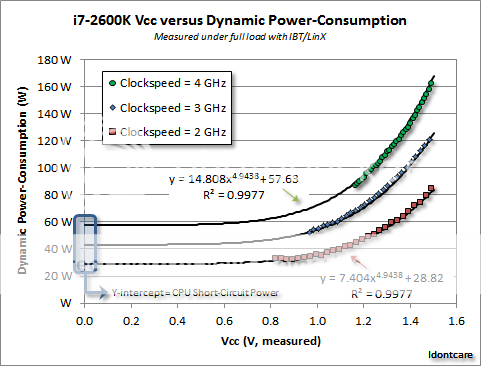
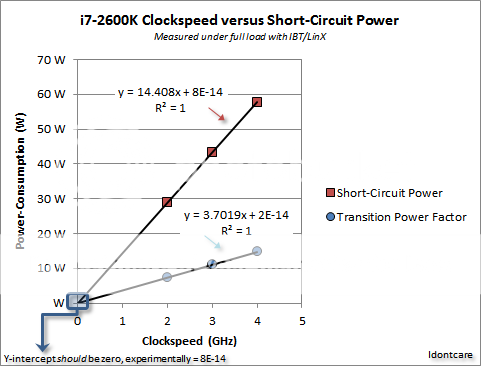
The result of this somewhat laborious process was the following graph of clockspeed versus power-consumption:
i7-2600KPower-ConsumptionwithH100NT-H1.png
 

Idontcare

Elite Member
Oct 10, 1999
21,118
58
91
Now my goal was to come up with the correct coefficients and parameters of the analytical equation that correctly describes the data seen in the above graph (seen at the bottom of post #1).

Starting with what I actually measured, power at the wall, we have:
PTotal.png


Where Psystem is the power consumed by everything not involved in the core logic of the CPU itself - the ram, the video card, the PSU (including power-losses from inefficient AC/DC conversion and so on), etc.

We expect the Psystem value to remain a constant value provided the hardware is operated identically across all the tests (ram speed remains unchanged, PSU efficiency remains mostly unchanged, etc):
Psystem.png


PCPU is taken to be the power consumed by the CPU cores and associated cache, including both static and dynamic power, at full load:
PCPU.png


Now PStatic is what we all refer to as "leakage" and it is the power lost due to current finding its way from the CPU's voltage to ground, since this process happens regardless whether the CPU is clocked slow or fast (it is invariant to clockspeed) it comes as no surprise that the value entirely depends on the CPU voltage alone:
PStatic.png

^m is a coefficient, we need to find the value for this for my i7-2600K (more on that later in the thread ;))

PDynamic is a more complicated expression involving two additional terms, one referred to as "Short-Circuit Energy" and the other is called the "Transition Energy":
PDynamic.png


The Transition energy is the on more commonly referred to by enthusiasts when we say "power consumption increases as the square of the voltage but only increases linearly with clockspeed frequency":
PTransition.png

^ the parameter α (alpha) is the activity parameter that depends entirely on the instruction mix and overall IPC utilization of the CPU (more activity means more power, i.e. it is software/app dependent); while the parameter C is entirely dependent on the design/layout of the chip (C for 2600K's will be different than C for 2500K than for SB-E's and so on).

You may also notice that I have chosen to express the voltage as being raised to a parameter "B" rather than the traditional value of "2", this will become more relevant later on in the thread but suffice it to say for now that the number is considerable higher than 2 for the Sandy Bridge as implemented in Intel's 32nm HKMG CMOS.

And lastly, the expression for the short-circuit energy is as follows:
PShort-Circuit.png

^ we have the same activity parameter, α (alpha), in addition to a fixed value for the power consumed per short-circuit event (intrinsic to the nature of CMOS circuit design) which occurs every time a xtor switches - hence the short-circuit power scaled linearly with the clockspeed of the CPU.

We add all the static and dynamic terms up for the CPU to arrive at:
PCPUannotatedformula.png


And finally, plugging this into our total power equation we arrive at:
PTotalformula.png
 

Idontcare

Elite Member
Oct 10, 1999
21,118
58
91
Following from the equation seen at the bottom of post #2, at this point it would have been simple enough to have simply plugged in the data from the graph at the bottom of Post #1 into mathematica or any online fitting program (I like ZunZun.com myself) and proceeded to just fit the parameters and be done with it.

But that approach would not have yielded any insight into how robustly applicable the assumptions are that have been taken in the formulation of the equation found at the bottom of Post #2.

Instead, we will reserve the data found in the graph at the bottom of the first post to be out "test" of the quality of the parameters and the equation at the end of this exercise.

First, we must arrive at an estimation for the value of the Psystem expression - the constant value of power that the ram/vid-card/PSU/etc are consuming.

To do this we need to acquire data at varying clockspeed while holding the operating voltage at a fixed value for the entire data series, then vary the Vcc and rerun the test, and again (minimum of three times):
i7-2600KVCCClockspeedversusPower-Consumption.png


Plotting the data we see that so long as we keep the voltage fixed - be it at 1.491 V or 0.972V - the power consumption varies linearly with a nice high R^2 value. (this one measure of the test of our assumptions regarding PSU efficiency and so on)

Of particular relevance in this plot are the y-intercept values, these alone do not represent system power, but they do represent the sum of system power and CPU leakage power.

Taking these y-intercept values (the BLUE diamond dots below) and plotting them with respect to the Vcc used to generate them results in:
i7-2600KSystemPowerandCPUStaticPower.png


The y-intercept of these values is the fixed system power for my specific computer setup. This value, 84.8 Watts, is unique to the components in my rig and every person's rig will have a different value.
PowerSystemvalue.png


From there, we subtract the system power - 84.8 W - from each of the three values that represented the y-intercepts on the previous graph (the blue-diamonds on this current graph) and we generate the values that are shown as red squares. These values represent the leakage power of the CPU at these particular voltages.

The slope of the best fit line through these values is the "m" parameter in our Static Leakage equation:
PStatic.png


And the fact that the computed y-intercept of the red line is practically identical to zero is an indication that our assumptions regarding the constancy of the system power is upheld (that's a good thing :thumbsup:)
Pstaticvalue.png


(next up, we'll tackle the dynamic power consumption :))
 
Last edited:

Idontcare

Elite Member
Oct 10, 1999
21,118
58
91
To compute the dynamic power we first must generate a different kind of data set from that we used above to determine the system power and static leakage power.

For this we must generate data in which we measure power-consumption while varying the operating voltage but holding the clockspeed constant.
Intel&


To use this data for determining the parameters involved in Dynamic power we must first subtract away the previously determined system power as well the static leakage power. Doing this leaves us with the following:
i7-2600KVccversusDynamicPower-Consumption.png


Note all three sets of data are fit to the exact same exponential parameter (4.9438), the equation for the 3GHz data is not shown (for clarity) but it was computed.

First, note that the y-intercept is the short-circuit power (which is clockspeed dependent but not Vcc dependent), and the premultiplier on the exponential varies by clockspeed but not by Vcc.

Taking these values (the y-intercept as well as the premultipiers) and plotting them with respect to clockspeed yields the following:
i7-2600KClockspeedversusShort-CircuitPower.png


This is another test of our assumptions, and the test proves in our favor, the R^2 values are quite high and the y-intercept values for the parameters are nearly identical to zero.

Remembering our dynamic power expression:
PDynamic.png


And that the short-circuit equation is:
PShort-Circuit.png


From the data analysis presented in the graphs above we determine the short-circuit power to be:
PShort-CircuitValue.png


Likewise recalling that the transition power equation is:
PTransition.png


We arrive at the following parameters based on the data analyses above:
PtransitionValue.png


^ but wait a minute...isn't the exponent supposed to only 2!? Now it is nearly 5!?

Yes, it's true. The transient power consumption attributable to clockspeed and GHz on Intel's 32nm process tech combined with the microarchitectural design of Sandy Bridge scales to nearly the fifth power of the operating voltage :eek:

I would LOVE to see how GloFo's 32nm process tech performs in this regard, if only I could get my hands on an unlocked Llano or an unlocked Zambezi :hmm:
 
Last edited:

Idontcare

Elite Member
Oct 10, 1999
21,118
58
91
OK, so we've got our system power, static power, short-circuit power, and our transient power finally figured out.

Putting it all together, we arrive at the following parameters and equation describing the total power consumption for the system:
Intel&


What does this look like in 3-dimension? A couple fancy ways to show this (the black squares are the data):
SurfacePlotLRP_2342_1317676095_88.png


We can also show this as a contour plot:
ContourPlotLRP_2342_1317676095_88.png


These graphs are pretty but they aren't very insightful, so let's return to our original objective - understanding the rapid rise in power-consumption of the i7-2600K as we near 5GHz clockspeeds and 1.5V Vcc's. Remember this graph:
i7-2600KPower-ConsumptionwithH100NT-H1.png


The data in this graph above were not used at all in the determination of the fitting parameters in the equation above, so let's see how well the equation fits the data:
i7-2600KPower-ConsumptionwithH100NT-H1Final.png


That's a rather nice R^2 value, and the black line are the values derived from the equation. :)

But let's see this data plotted a little differently, with the equation being used to parse out the various contributors to the overall power-consumption curve:
i7-2600KPower-ConsumptionAnalysis.png


Personally I think this graph is rather cool :D It highlights the reality that
  1. System Power more or less stays the same, regardless of clockspeed
  2. Static Power (leakage) increases somewhat in going from 1.6GHz to 5GHz (because doing so requires the Vcc to rise from 0.8V to 1.5V), and at lower clockspeeds below 2GHz the static leakage is greater than the dynamic power consumption
  3. Short-Circuit Power contributes a significant portion of the dynamic power at 5GHz, but owns the lions share portion of it at lower clockspeeds
  4. Transition Power is what really drives the growth in overall power-consumption as the clockspeeds approach 5GHz, not surprisingly, but with a power function that contains an exponent value nearing 5 (!), the transition power rises extremely sharply at 5Ghz and beyond
 
Last edited:

Idontcare

Elite Member
Oct 10, 1999
21,118
58
91
Using these equations, combined with the equation that defines minimum voltage necessary for stable operation of the 2600K as needed to pass 5 iteration of IBT:
i7-2600KonMIVE-Z.png


We can use the power-consumption equation to make some projections about the power-consumption at hypothetical clockspeeds such as 6GHz and 7GHz (a suggestion by fellow forum member yottabit :thumbsup:).

The data graph above showing the necessary Vcc for certain clockspeeds indicates that in order to pass 5 cycles of IBT/LinX at 6GHz we need a Vcc of 2.051 V which would drive a CPU power consumption of 956 Watts! :eek:

At 7GHz the chip would need 2.939V to be stable for 5 passes in IBT, but in doing so the power-consumption for the CPU would surge to 5.6kW! D:

I guess there is a good reason why we don't see 7GHz Sandy Bridges in laptop form factors :D :p

And that's it. Personally, I found this adventure quite entertaining and rewarding. It took nearly a full week just to generate the data, another few days to perform the data reduction and analysis, and surprisingly a good chunk of time just to write up the posts I've added to this thread. I hope its enjoyable for the community here as well which is why I figured I'd go ahead and post it up.

Feedback and questions/comments are welcome! Hope I get to do this with a zambezi too (will depend on the budget and amount of freetime of course).

I'm sure there is an error or two here and there above, but this is the internet, y'all got what you paid for here and I hope it was worth every penny :D

Enjoy :)
 

Idontcare

Elite Member
Oct 10, 1999
21,118
58
91
Oh yeah, I meant to add a couple final graphs showing all the data in full shot:
Intel&


And the surface plot:
SurfacePlotLRP_9814_1317678944_43.png
 
Last edited:

Vesku

Diamond Member
Aug 25, 2005
3,743
28
86
I see now why the extreme OCers don't usually run any benchmarks. Would probably burn out the socket trying to deliver a stable 6+GHz.

Fun factoid I saw today, the current world's fastest supercomputer needs roughly 10MW of power. Sure sounds like a lot but that's only 10-20 thousand OCed enthusiast machines.
 

grimpr

Golden Member
Aug 21, 2007
1,095
7
81
:thumbsup:

A testament to idontcare's scientific skills and Anandtechs community.
 

ViRGE

Elite Member, Moderator Emeritus
Oct 9, 1999
31,516
167
106
We really need an :applause: emoicon, Idontcare. That's a beyond-excellent breakdown of power consumption.:)
 

Idontcare

Elite Member
Oct 10, 1999
21,118
58
91
^ thanks everyone for the kind words :$:$:$:$
I see now why the extreme OCers don't usually run any benchmarks. Would probably burn out the socket trying to deliver a stable 6+GHz.
Exactly.

Take this same chip and setup, I need 1.495V to be IBT stable at 5GHz, but I can drop the Vcc all the way down to 1.350V and be stable enough to run SPi and PCMark99 at 5GHz.

The current involved is definitely an issue, as is the heat dissipation.

After running through these numbers it became crystal clear why 10GHz was just an unrealistic goal for Netburst back in the day. D:

Try pulling a kW of power through the surface area of a postage stamp while keeping the heat source under 100C, if you can do that then NASA and the DOE has a job waiting for you :D

Suicide runs are quite aptly named :p
 

OVerLoRDI

Diamond Member
Jan 22, 2006
5,494
4
81
Idontcare, this is awesome. Way to contribute to the forum in a meaningful way. Anand might want to consider you for writing articles for the main site :p

I'm surprised by degree of the exponential growth, 5 is a scary number to exponentiate power consumption by.

You have inspired me to do the same thing with my 6970s. Perhaps when school eases up ;)
 

mrjoltcola

Senior member
Sep 19, 2011
534
1
0
Excellent IDC!

1) I would be interested in seeing a second 2600K on the same graph. With people reporting different results in OC, would we see similar curve, but with a constant shift (left or right) by a few hundred Mhz, or would we see a flatter graph? What do you think?

2) Could we use 2 data points to extrapolate the OC potential for a given chip, without actually overclocking or overvolting it significantly?
 

Idontcare

Elite Member
Oct 10, 1999
21,118
58
91
Excellent IDC!

1) I would be interested in seeing a second 2600K on the same graph. With people reporting different results in OC, would we see similar curve, but with a constant shift (left or right) by a few hundred Mhz, or would we see a flatter graph? What do you think?

2) Could we use 2 data points to extrapolate the OC potential for a given chip, without actually overclocking or overvolting it significantly?

What you are looking at there (and here) is basically a really sexied-up shmoo plot.

Intel&


The thing with shmoo plots is that while it is true that you can expect a general distribution to arise and adhere to the boundaries of the plot, the sample to sample variation is expected to be quite significant owing to process-induced chip-to-chip variation.

What this means is that yes you will get chips that more or less simply have a voltage offset in the scaling like the following:
ShmooplotCaseA.jpg


But you can, and will, also come across chips for which the slope of the shmoo plot is such that despite having a higher VID, the required voltage to stable operation at higher clocks can actually be lower than that required for a chip which has a lower VID, like this:
ShmooplotCaseB.jpg
 

Idontcare

Elite Member
Oct 10, 1999
21,118
58
91
This is kinda cool, if you want to see the surface plot in a dynamically controllable 3D environment you can go to this link and install the "VRML plugin: Cosmo Player".

Once installed, at some point it is going to prompt you to pick the renderer. I went with "auto" which caused it to bomb out. Then I went with "Direct3D" and it works great.

Now you just click this link and let the browser open the vrml file (cosmo will run inside the browser).

You'll probably have to zoom out a bit, then you just click and drag the surface to flip it around and look around.

Its of no scientific value, but it is pretty neat IMO.
 

dma0991

Platinum Member
Mar 17, 2011
2,723
1
0
Hardware technicality beyond my comprehension but a nice read and great post nonetheless. :D
 

PreferLinux

Senior member
Dec 29, 2010
420
0
0
Excellent work, and very interesting!

Just a comment: the y-intercepts that should be, but are not exactly, 0 are well within experimental error, so they can be regarded as being 0 – they are something like 1E-13 +/- 1E-2.
 

Idontcare

Elite Member
Oct 10, 1999
21,118
58
91
^ yeah that's basically what I did, I just took the computed slope value and left the near-zero y-intercept to be equal to zero. My point I guess was more just to show that I did not have to force it to be zero in the fitting program, it actually was zero.

I am at a loss, as a scientist, to explain how the results worked out to be so close to theory like that. Armed with a power meter that is at best accurate to maybe 1W and so on. I really expected more "slop" in the R^2 values and so on.

Near as I can rationalize it, this is just one of those cases where if you happen to have a lot of data then the errors really do average out to an insignificant level.

I did scratch my head a bit over that. Had my employer asked me to do the same work I would have had the thing hooked up to $30k o-scopes, contained in an isothermal chamber, and so on...and my data would have prolly been more "noisier" than what I got here with a $20 kill-a-watt and a $15 home-depot voltmeter :D
 

Ben90

Platinum Member
Jun 14, 2009
2,866
3
0
Can you please re-run the results at different temperatures to add another dimension to power scaling?

I kid, that must have been an insane amount of work. I am curious to your findings that system power consumption stays the same despite clock speed. I thought working the RAM that much harder would have increased it at least a few watts.
 

Abwx

Lifer
Apr 2, 2011
10,947
3,457
136
Transition Power is what really drives the growth in overall power-consumption as the clockspeeds approach 5GHz, not surprisingly, but with a power function that contains an exponent value nearing 5 (!), the transition power rises extremely sharply at 5Ghz and beyond

Seems that this arise from complementary push pulls increasing
crossconduction with frequency increasing, such that a frequency
high enough , close to the devices frequency transition, the two
legs of the push pulls are simultaneously conducting , with the current
limited only by the devices finite transconductance , wich as such ,
will yield about a quintic law out from a law that is basicaly exponential
if it was not restrained by the said gm (transconductance) finite value..

On another note , a very good article , indeed...
 

Zap

Elite Member
Oct 13, 1999
22,377
2
81
Is there a tl;dr version? All I get is the curve starts going up at a steeper angle around 4.5GHz.