- May 1, 2020
- 722
- 1,149
- 136
Dear Community,
so this is my first thread here as a long-time lurker - but I felt the desire to share a small hobby-project of mine from the last couple of months with you...
Performance Efficiency Suite - What is it about?
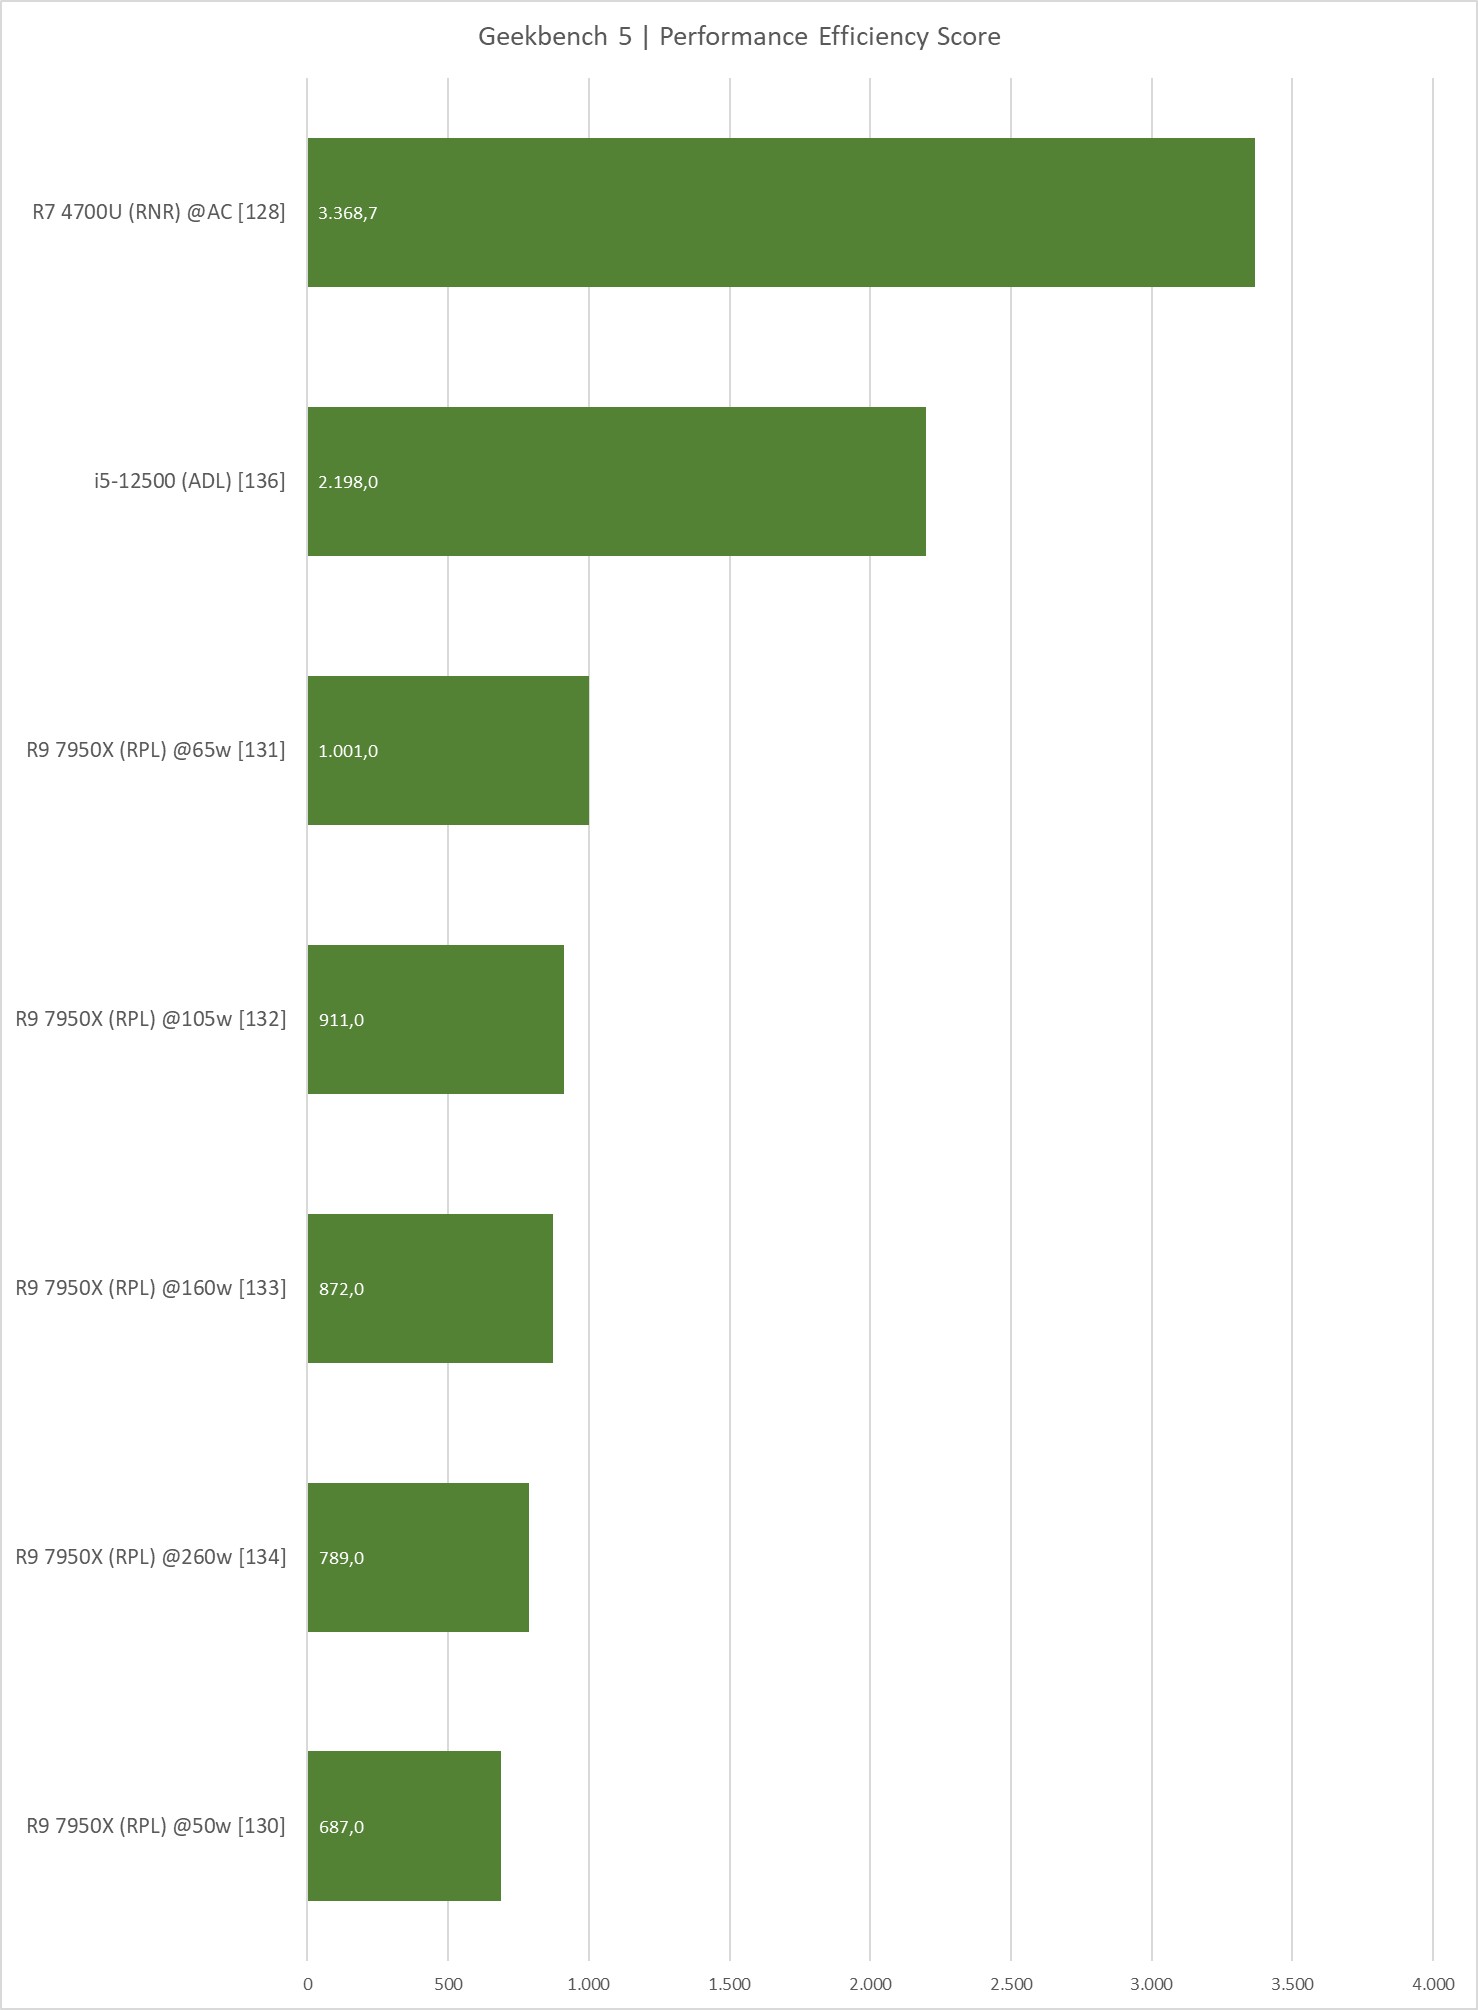
Most Reviewers solely focus on what they consider to be the most important aspect of modern CPUs - the absolute performance. But this is only one side of the equation. Today Power Efficiency is at least as important - or to be more precise: The amount of energy (Wattseconds or Joules) a CPU needs in order to accomplish a given workload. Sadly most Reviewers shy away from the extra mile it needs to assess this aspect. This suite measures the Total Package Power of a CPU while running the Cinebench R23 benchmarks first in single-threaded mode (1 run), then running in multi-threaded mode (for 10 minutes + whatever it takes to finish the last run). The results will be rendered in the provided Results.xlsx Excel file. To combine Efficiency and Performance there is also a score provided called Performance Efficiency Score (how amazingly inspired I am ).
).
In the meantime I was able to aggregate more than 80 samples from members of the 3DC & CB communities (see below).
How-To
Some explanations about the Suite
Online Resources
Disclaimer
I am by no means a Powershell professional or a professional Reviewer. I was just sick of the lack of information and wanted to propose a low-effort solution. Any input for further improvement is highly welcomed. Please feel free to use/extend/rip-off this solution as you wish. But please share your findings to the world.
so this is my first thread here as a long-time lurker - but I felt the desire to share a small hobby-project of mine from the last couple of months with you...
Performance Efficiency Suite - What is it about?
Most Reviewers solely focus on what they consider to be the most important aspect of modern CPUs - the absolute performance. But this is only one side of the equation. Today Power Efficiency is at least as important - or to be more precise: The amount of energy (Wattseconds or Joules) a CPU needs in order to accomplish a given workload. Sadly most Reviewers shy away from the extra mile it needs to assess this aspect. This suite measures the Total Package Power of a CPU while running the Cinebench R23 benchmarks first in single-threaded mode (1 run), then running in multi-threaded mode (for 10 minutes + whatever it takes to finish the last run). The results will be rendered in the provided Results.xlsx Excel file. To combine Efficiency and Performance there is also a score provided called Performance Efficiency Score (how amazingly inspired I am
In the meantime I was able to aggregate more than 80 samples from members of the 3DC & CB communities (see below).
How-To
- Unzip the latest release to wherever you want EXCEPT on your local OneDrive folder.
- Open Settings.txt and insert your local Cinebench23 Directory.
- Run PES Start - it will ask for Administrator rights as these are needed for measuring Package Power
- Wait until the Powershell finishes.
- Open the Excel file...
- Allow external connections (to the generated CSV-files with the data)
- Go to Data -> Refresh all
- Enjoy and share your results - just take a screenshot of what the Excel renders.
- If you want to do multiple measurements with different settings just copy the Excel file (inside the root-folder) before running and refreshing the data.
Some explanations about the Suite
- This Suite has been made possible by Michael Möller and his amazing free and open-source Open Hardware Monitor and his .NET Library OpenHardwareMonitorLib.dll - Thanks a lot!!!
Homepage: https://openhardwaremonitor.org/
GitHub: https://github.com/openhardwaremonitor - The results for the Package Power look pretty accurate compared to the sparse data the internet provides. Seems, that the vendors are much more honest with those sensors than they are with temperature etc.
- The suite basically consists some powershell scripts and an Excel file for presentation purposes
- RunAsAdminWrapper.ps1
This is needed to have a convenient relative path shortcut in the root folder and request admin-rights at the same time - Main.ps1
- After setting up some stuff it basically starts the Cinebench R23 one at a time. It then checks for the "Cinebench.exe" process being active.
- While this is true it queries the Package Power Sensor data with a lower bound of 10ms (in order to keep CPU-load of the script at bay).
- After each run the aquired data gets pushed to CSV files located in the LogCsv subfolder.
- Results.xslx
- The Excel file basically just does some import, calculations and a hopefully nice presentation of the data.
- Histogram
The bold line shows a running average of the last 100 data-points which should be sufficiently accurate. The pale line shows each single data-point. - Calculation of Total Package Consumption
To get that number we need the integral. That is why we first calculate the timeframe between two data-points and then multiply the measured value. - Everything else in that Excel is hopefully more or less self-explaining
- RunAsAdminWrapper.ps1
Online Resources
Disclaimer
I am by no means a Powershell professional or a professional Reviewer. I was just sick of the lack of information and wanted to propose a low-effort solution. Any input for further improvement is highly welcomed. Please feel free to use/extend/rip-off this solution as you wish. But please share your findings to the world.
Last edited:


