Discussion PES | Assessing Power and Performance Efficiency of x86 CPU architectures

Page 3 - Seeking answers? Join the AnandTech community: where nearly half-a-million members share solutions and discuss the latest tech.

BorisTheBlade82

Senior member
May 1, 2020
660
1,003
106
Dear Community,

so this is my first thread here as a long-time lurker - but I felt the desire to share a small hobby-project of mine from the last couple of months with you...

Performance Efficiency Suite - What is it about?
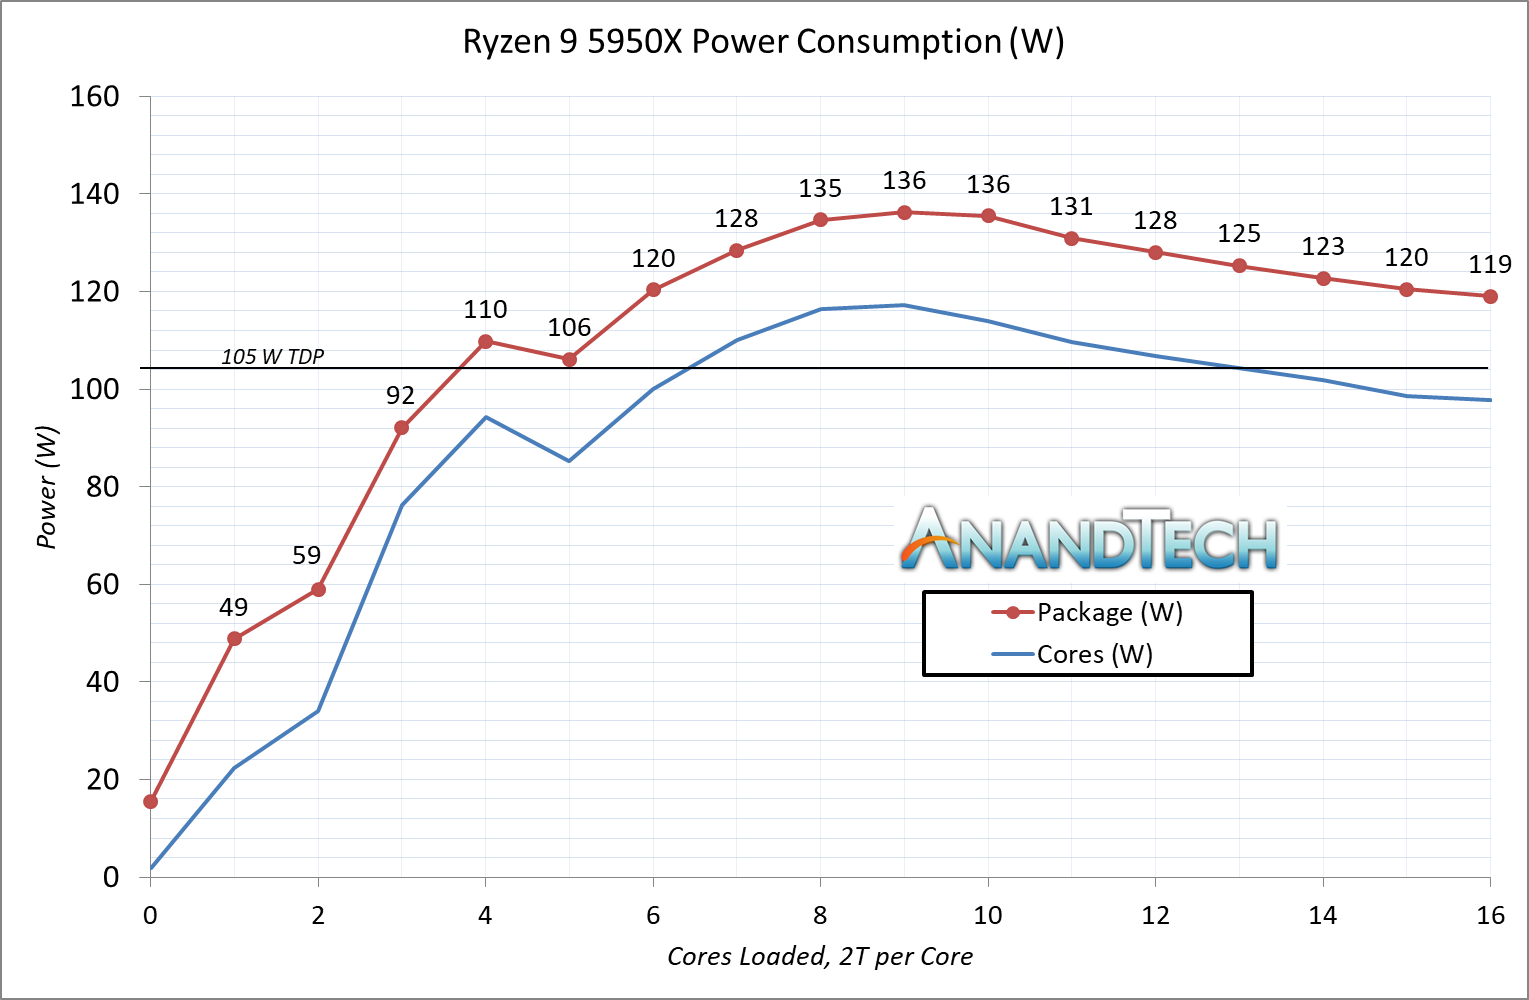
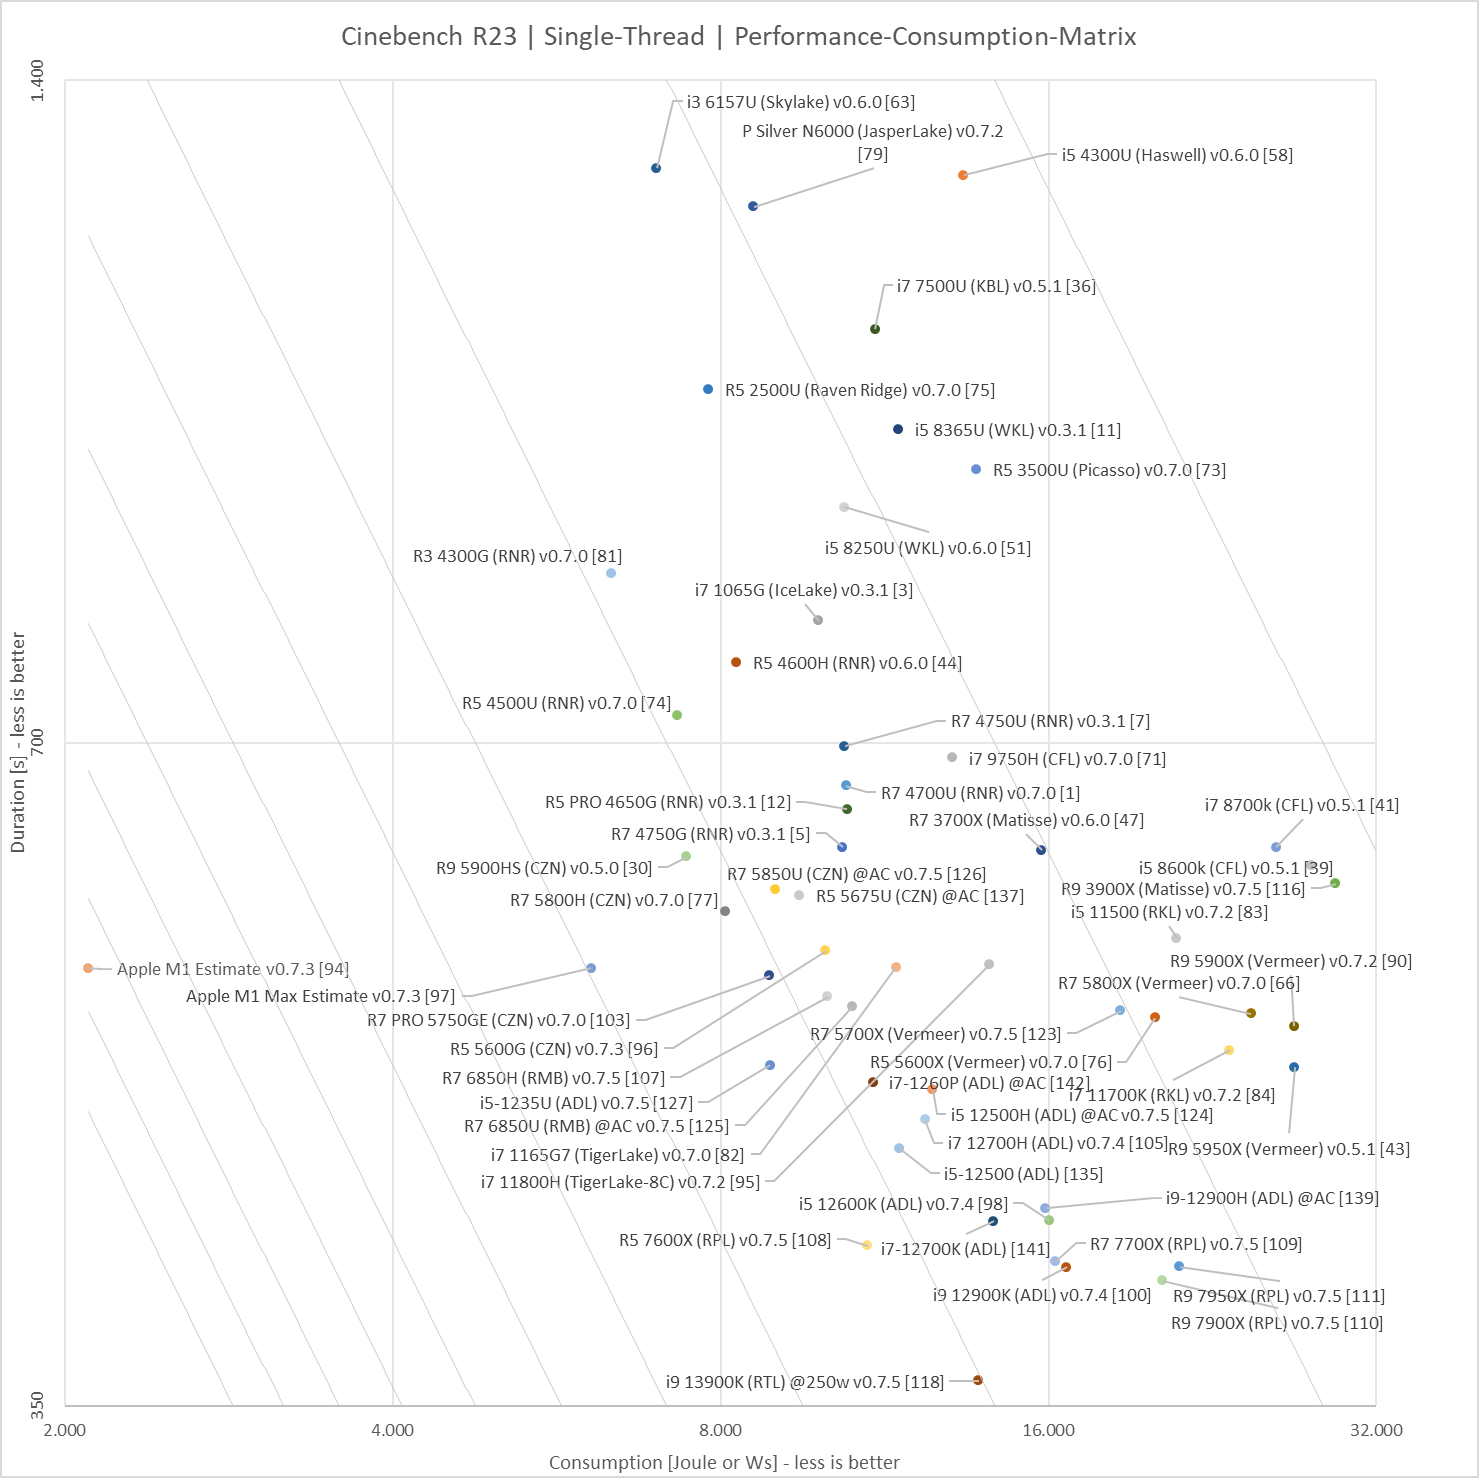
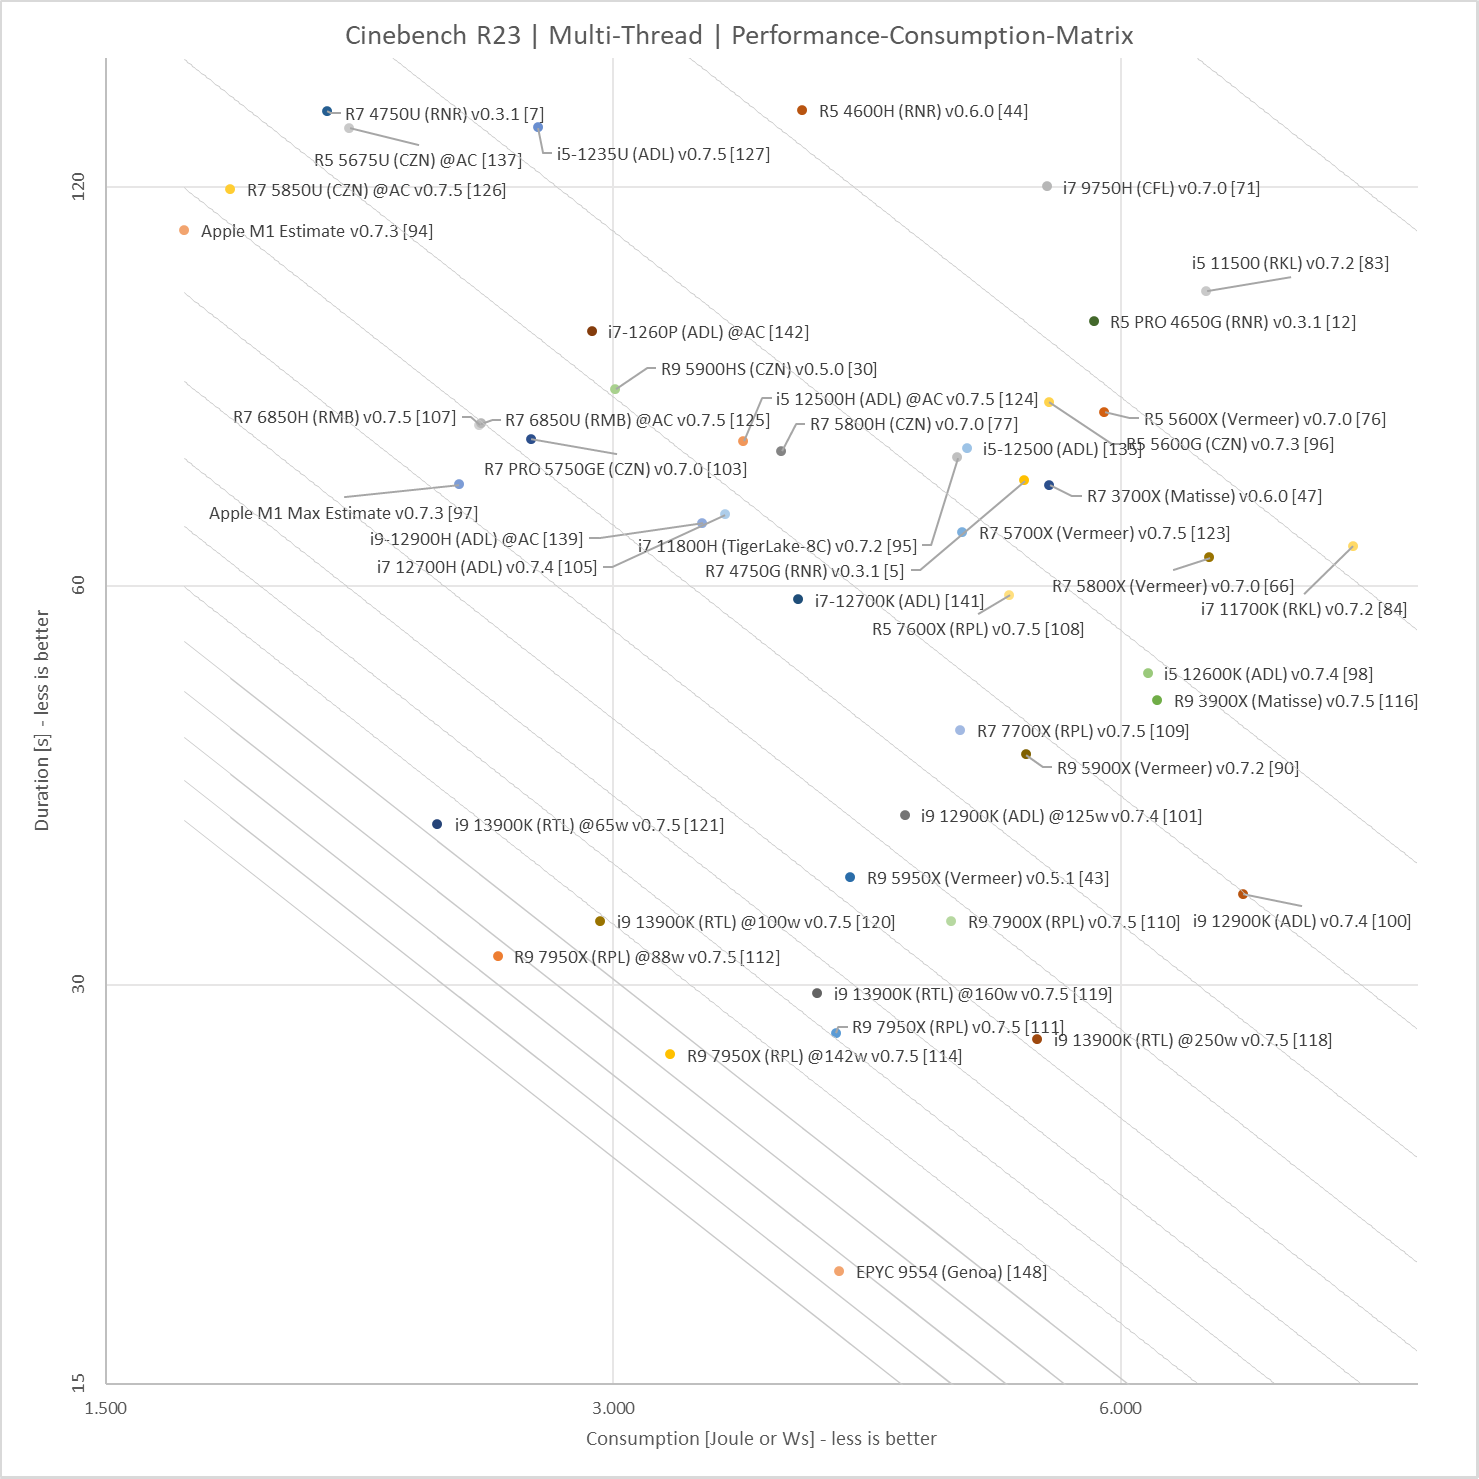
Most Reviewers solely focus on what they consider to be the most important aspect of modern CPUs - the absolute performance. But this is only one side of the equation. Today Power Efficiency is at least as important - or to be more precise: The amount of energy (Wattseconds or Joules) a CPU needs in order to accomplish a given workload. Sadly most Reviewers shy away from the extra mile it needs to assess this aspect. This suite measures the Total Package Power of a CPU while running the Cinebench R23 benchmarks first in single-threaded mode (1 run), then running in multi-threaded mode (for 10 minutes + whatever it takes to finish the last run). The results will be rendered in the provided Results.xlsx Excel file. To combine Efficiency and Performance there is also a score provided called Performance Efficiency Score (how amazingly inspired I am ;)).

In the meantime I was able to aggregate more than 80 samples from members of the 3DC & CB communities (see below).

How-To
  1. Unzip the latest release to wherever you want EXCEPT on your local OneDrive folder.
  2. Open Settings.txt and insert your local Cinebench23 Directory.
  3. Run PES Start - it will ask for Administrator rights as these are needed for measuring Package Power
  4. Wait until the Powershell finishes.
  5. Open the Excel file...
  6. Allow external connections (to the generated CSV-files with the data)
  7. Go to Data -> Refresh all
  8. Enjoy and share your results - just take a screenshot of what the Excel renders.
  9. If you want to do multiple measurements with different settings just copy the Excel file (inside the root-folder) before running and refreshing the data.

Some explanations about the Suite
  • This Suite has been made possible by Michael Möller and his amazing free and open-source Open Hardware Monitor and his .NET Library OpenHardwareMonitorLib.dll - Thanks a lot!!!
    Homepage: https://openhardwaremonitor.org/
    GitHub: https://github.com/openhardwaremonitor
  • The results for the Package Power look pretty accurate compared to the sparse data the internet provides. Seems, that the vendors are much more honest with those sensors than they are with temperature etc.
  • The suite basically consists some powershell scripts and an Excel file for presentation purposes
    • RunAsAdminWrapper.ps1
      This is needed to have a convenient relative path shortcut in the root folder and request admin-rights at the same time
    • Main.ps1
      • After setting up some stuff it basically starts the Cinebench R23 one at a time. It then checks for the "Cinebench.exe" process being active.
      • While this is true it queries the Package Power Sensor data with a lower bound of 10ms (in order to keep CPU-load of the script at bay).
      • After each run the aquired data gets pushed to CSV files located in the LogCsv subfolder.
    • Results.xslx
      • The Excel file basically just does some import, calculations and a hopefully nice presentation of the data.
      • Histogram
        The bold line shows a running average of the last 100 data-points which should be sufficiently accurate. The pale line shows each single data-point.
      • Calculation of Total Package Consumption
        To get that number we need the integral. That is why we first calculate the timeframe between two data-points and then multiply the measured value.
      • Everything else in that Excel is hopefully more or less self-explaining

Online Resources

Disclaimer
I am by no means a Powershell professional or a professional Reviewer. I was just sick of the lack of information and wanted to propose a low-effort solution. Any input for further improvement is highly welcomed. Please feel free to use/extend/rip-off this solution as you wish. But please share your findings to the world.
 
Last edited:

BorisTheBlade82

Senior member
May 1, 2020
660
1,003
106
@Hulk
While I did the first testing I queried the sensors as often as possible. There I realized two things: The querying itself causes quite some CPU load when done too often. And the sampling frequency is not very steady. That is why I wait at least 10ms before the next query. That causes next to no load and is "accurate enough" for me. And because the sampling frequency is not that uniform I needed to take into account the time frames between two samples. So I have a weighted average.

To your next question: Yes, the frequency is available as well and yes, I like your idea of generating some nice IPC numbers. Will think this through a littlebit.
But what HWInfo measures is something else and I do not know what that is. They seem to be taking clock gating and other power saving measures into account. Because my Ryzen never goes below 1400Mhz IIRC but they are showing that effective clock to be near 0 when idling.
 
  • Like
Reactions: Hulk

BorisTheBlade82

Senior member
May 1, 2020
660
1,003
106
5600G @45W (set in bios, memory 3600MHz XMP, other settings at stock), fully passive (CPU that is) which begins to show in multi runs, build in progress picture below. PSU stays also passive with these loads (WAF requirement for living room ;))
Thanks for sharing your numbers - and of course the WAF is priceless ;)

Your MT chart let's me think that your 45w cTDP from the BIOS does not stick. Looks more like standard 65w TDP with thermal throttling after a while. Have you ever tried RyzenAdj/RyzenController?
All in all I would have expected better - maybe it is your RAM settings that make your power efficiency take a dive?
 

BorisTheBlade82

Senior member
May 1, 2020
660
1,003
106
Update
  • first sample of a Desktop-Cezanne (R5 5600G from @mmaenpaa)
  • estimated results of an Apple M1 based on publicly available numbers for CBR23 performance and average consumption from Andrei (AT) and @sallymander (see post #44 for details)
As expected the M1 is blowing the ST charts. It is 4 times more performance-efficient than anything else. This becomes especially clear if we take a look at the performance-efficiency x-y-chart. For reference I added the Pareto-Optimum-lines of M1 and the next best competitor (a R9 5900HS Cezanne). M1 is so much better that it becomes moot to attribute this only to the TSMC 5nm process and the Software eco-system. There must be something groundbreaking in the architecture (obviously a combination of several factors) that AMD and Intel have not been able to come up with until now.

CB_Perf_Power_ST.png
 

sallymander

Junior Member
Nov 20, 2020
12
30
61
Here's what I found on my M1 for multithread - my score is a little lower than Andrei found.

7519 CB MT score at 13.2w average (duration 113 seconds). P-cores: 12w, E-cores: 1.2w
Total power usage: 1491.6J

This is using "CPU Power" rather than "Package Power", logging data with powermetrics every 10ms.

When the system is fully loaded the P-cores seem to run at 2988 Mhz and the E-cores top out at 2064 Mhz.

The peak CPU power was 19.1w (P-cores: 17.6, E-cores: 1.5w).
 
  • Like
Reactions: BorisTheBlade82

mmaenpaa

Member
Aug 4, 2009
78
136
106
Thanks for sharing your numbers - and of course the WAF is priceless ;)

Your MT chart let's me think that your 45w cTDP from the BIOS does not stick. Looks more like standard 65w TDP with thermal throttling after a while. Have you ever tried RyzenAdj/RyzenController?
All in all I would have expected better - maybe it is your RAM settings that make your power efficiency take a dive?

I did a few reruns with active fan with different settings (PBO on auto, ASUS ROG Strix B550-I Gaming, mem at 3600MHz)

1634496428063.png

CPU 65W (default)
5600G_65W_PBO_AUTO_FAN.png
CPU 45W (set with Ryzen Controller)
5600G_45W_PBO_AUTO_FAN.png
CPU 35W (Ryzen Controller)
5600G_35W_PBO_AUTO_FAN.png

25W (Ryzen Controller)
5600G_25W_PBO_AUTO_FAN.png

15W (Ryzen Controller)
5600G_15W_PBO_AUTO_FAN.png

10W (Ryzen Controller)
5600G_10W_PBO_AUTO_FAN.png
 

sallymander

Junior Member
Nov 20, 2020
12
30
61
I did one more test with my M1 Mac Mini using 4 Cinebench threads to try to isolate the performance cores.

R23 MT (4 threads): 5618 score at 12.7w (duration 142 seconds). P-cores: 12.7w, E-cores: 0.08w
Total power usage: 1803.4J

I think that means the E-cores are contributing about 25% of the total score (for all 8 threads) with only 10% of the power usage.
 
Feb 17, 2020
100
245
116
There must be something groundbreaking in the architecture (obviously a combination of several factors) that AMD and Intel have not been able to come up with until now.

Not much groundbreaking, just a smart design and executives who listen to engineers and tell marketing to mind their own business and leave them alone. By which I mean Apple's not sacrificing power or ipc for frequency. I really wish I was joking here, but let me explain a bit more.

Both AMD and Intel are still completely fixated on getting the highest possible frequency, with the rationale being that consumers only understand computer chips in the most basic form of "more cores and more gigahertz is more better". So they will basically refuse any architecture that cuts into that max frequency, even if the power savings and IPC more than make up for it. To put a cherry on top, you actually need to burn extra power to reach 5+ ghz, and a lot of it. You see, small cells are slow, so faster designs have bigger cells, which are bigger and consume more area. And the closer you get to tapping out the technology, the more the power draw bootlegs up. And AMD and Intel have more than tapped out the technology. Reducing the target frequency a bit can get rid of the bootleg, and also comes with inherent IPC benefits. With a slower clock cycle, caches and memory are comparatively faster. They don't care about what frequency the cpu operates on, so a lower clocked cpu has to wait fewer cycles for memory accesses to load, which directly increases IPC with literally zero effort. Then you can get into using the extra time to do more work per cycle, which may let you cut a stage from the pipeline and get more ipc. Or make the core wider and bigger to process more instructions. Or you could calculate more accurate clock gating terms, which saves power. Or do all of the above.

To go back to the 4x power efficiency figure you measured, I'd wager that about half of that is tied directly to AMD and Intel's braindead approach to cpu design. Of the half that's left, half of that is probably N5, and the other half is a mix of software and architecture. It's truly baffling. One reason I've been looking forward to Gracemont in Alder Lake is that it might be a sign that Intel's finally started to pull its head out of its a**. I really do hope that they shift their design targets, since it'll lead to dramatic efficiency improvements immediately.

And if your initial response is "why would Intel and AMD still design chips this way?", just look at their sales numbers. At least Intel's finally going for big.little, but even that's only with the caveat of have grossly oversized big cores that they can advertise as hitting 5.5ghz or whatever it'll end up at.
 

sallymander

Junior Member
Nov 20, 2020
12
30
61
I wonder if idle power draw also makes the x86 ST efficiency look far worse compared to the MT results (looking at Andrei's Zen 3 review the 5950x has an idle power draw of almost 20W).

I'm curious how the scaling would look if you compared total Core power vs Package power like in this graph:

PerCore-1-5950X-Total.png


Obviously the 5950X is going to be a worse case for idle power due to the number of cores but looking at the graphs people have posted most x86 systems are running at greater than 5W when idle.

Idle package power on the M1 seems to be less than 0.1w (I guess due to the E-cores and better power gating).

e.g.

ANE Power: 0 mW
DRAM Power: 61 mW
CPU Power: 9 mW
GPU Power: 0 mW
Package Power: 9 mW
 

BorisTheBlade82

Senior member
May 1, 2020
660
1,003
106
@trexfromouterspace
I could not agree more with what you wrote.

@sallymander
Of course, the chiplet approach and especially the Interconnect via organic package has its efficiency drawbacks. Info-LSI, EMIB et al. will improve that. But for the time being it is inherent to the Zen desktop architecture and IMHO it would be unfair to exclude that aspect.
 
  • Like
Reactions: ikjadoon

BorisTheBlade82

Senior member
May 1, 2020
660
1,003
106
Here's what I found on my M1 for multithread - my score is a little lower than Andrei found.

7519 CB MT score at 13.2w average (duration 113 seconds). P-cores: 12w, E-cores: 1.2w
Total power usage: 1491.6J

This is using "CPU Power" rather than "Package Power", logging data with powermetrics every 10ms.

When the system is fully loaded the P-cores seem to run at 2988 Mhz and the E-cores top out at 2064 Mhz.

The peak CPU power was 19.1w (P-cores: 17.6, E-cores: 1.5w).
Do you know what is excluded when using cpu power vs. Package Power? Because I would like to have an apples to apples comparison (pun intended).

Edit: Oh, and thanks a lot for your numbers - really appreciate this.
 

sallymander

Junior Member
Nov 20, 2020
12
30
61
Do you know what is excluded when using cpu power vs. Package Power? Because I would like to have an apples to apples comparison (pun intended).

Edit: Oh, and thanks a lot for your numbers - really appreciate this.

That's a very good question - it seems to track CPU + GPU + Neural Engine power pretty closely but will occasionally spike up for very short periods of time.

The biggest spike I saw was up to 31.8W - I'm not sure what this is measuring or it's just double counting somehow:

*** Sampled system activity (Sun Oct 17 18:05:47 2021 +0100) (14.65ms elapsed) ***

ANE Power: 0 mW
DRAM Power: 341 mW
CPU Power: 19107 mW
GPU Power: 0 mW
Package Power: 19107 mW

*** Sampled system activity (Sun Oct 17 18:05:47 2021 +0100) (14.74ms elapsed) ***

ANE Power: 0 mW
DRAM Power: 339 mW
CPU Power: 19062 mW
GPU Power: 0 mW
Package Power: 31814 mW

*** Sampled system activity (Sun Oct 17 18:05:47 2021 +0100) (13.78ms elapsed) ***

ANE Power: 0 mW
DRAM Power: 435 mW
CPU Power: 18649 mW
GPU Power: 0 mW
Package Power: 18649 mW


I'm also not sure if it also includes things like the storage controller, wifi, bluetooth and other components on the SoC. I guess this is the main problem with comparing power numbers between tools and architectures!

It doesn't appear to include DRAM power (even though that is actually listed).

For Cinebench MT the difference was about 1.6W averaged over the whole run (CPU Power: 13.2W, Package Power: 14.8W).
For Cinebench ST it was essentially identical (3.8W for both).
 
  • Like
Reactions: BorisTheBlade82

BorisTheBlade82

Senior member
May 1, 2020
660
1,003
106
Update
  • updated the sample for a R5 5600G (Cezanne) from @mmaenpaa as the numbers look more in line
  • added an i7-11800H (TigerLake-8C) from Saugbär @ 3DC
  • refactored the Performance-Consumption-Matrices
    • They now have logarithmic scales in order to allow better understanding of the relative differences.
    • Added ISO-PES lines in order to make interpretation easier
  • added/updated Apple M1 / M1 Max estimates
    • for consumption I use the numbers provided by the AT M1 Max article as well as the numbers from @sallymander and Andrei F.
    • For duration I changed the approximation: I take the CB R23 score and compare them to the massive entry list of https://www.computerbase.de/2020-11/cinebench-r23-community-benchmarks/
      Then I take the duration of the nearest sample I have numbers for. This is to take into account that I do not only measure the CB R23 run but also the start of the application and the preparation phase of the scene.
      • for ST M1 and M1 Max are identical to i7 1165G, so 553 seconds
      • for MT M1 is identical to an AMD R5 2600X, so 111,3 seconds
      • for MT M1 Max is identical to an AMD R7 3700X, so 71,5 seconds
    • To point this out: These estimates are more or less a worst case for M1 as I am taking the peak consumption numbers for calculation that will not apply for 100% of the run.
    • The general trend still applies - M1 and M1 Max are pretty much in a league of their own:
      • ST power efficiency:
        M1 is 3,5x better than an AMD R9 5900HS (Cezanne). M1 Max is only 22% better than the R9 5900HS. I guess this is due to the massive RAM controllers which are clearly not made for ST and CPU-only work.
      • ST performance efficiency:
        M1 is 4x better than R9 5900HS. M1 Max is again only 37,5% better.
      • MT power efficiency:
        M1 is 80% better while M1 Max is 24% better.
      • MT performance efficiency:
        M1 is 37% better while M1 Max is 46% better.
  • Teaser: Keep your fingers crossed that we might see the first Alder Lake sample in the coming days ;)
 
  • Like
Reactions: Drazick and Viknet

BorisTheBlade82

Senior member
May 1, 2020
660
1,003
106
So we have some very interesting new results:
  • Andreas Schilling was so kind to provide us with some results for the i9 12900K Alder Lake under different Power Limits of 241w, 125w and 65.
  • Freiheraus@CB posted results for an AMD R7 PRO 5750GE (Cezanne, 35w TDP, 8c/16t). He measured not only @Stock but also @15w cTDP. And as we are still lacking Cezanne-U samples I will take this as a replacement for the time being.
  • Aside from the Apple universe the Cezanne is the most performance and power efficient CPU in ST to date. M1 is still leaps and bounds ahead in both power and performance efficiency.
  • In MT the Cezanne @15w is the single most power efficient CPU to date - even besting the Apple M1.
For Alder Lake I will dedicate another post as there are a lot of quite interesting things to point out.

CB_Perf_Power_ST.png


CB_Perf_Power_MT.png


For updated rankings please see the opening posts.
 
Last edited:

BorisTheBlade82

Senior member
May 1, 2020
660
1,003
106
@jeanlain
You are right. As the title of the thread says I had x86 in mind first and foremost. Some reviewers already pointed to the aspect that for example Apple's M1 looks a bit weak in CB23 compared to other workloads. So this IMHO further emphasizes just how competitive it really is.

What kind of (free) workload would you suggest?
 
  • Like
Reactions: jeanlain

beginner99

Diamond Member
Jun 2, 2009
5,208
1,580
136
Not much groundbreaking, just a smart design and executives who listen to engineers and tell marketing to mind their own business and leave them alone. By which I mean Apple's not sacrificing power or ipc for frequency. I really wish I was joking here, but let me explain a bit more.
....

Is it really true so? Intel and AMD make their money selling server CPUs and servers are usually sold by OEMs as an assembled unit and not just the CPU. So the gamer kids that care about many Ghz are pretty much irrelevant for Intel or AMD. Server customers actually care greatly about efficiency.

All x86 consumer CPUs run above their ideal voltage curve because they were designed for servers and not laptops. AMD and intel just up the voltage and frequency to be at the top of the charts, more or less and to have more market segmentation as actually make use of binning. if enough of chips can do 5.5ghz, why not offer such an SKU?

It also explains why the M1 is so much ahead in ST. Consumer workloads mostly are ST driven. And apples customers are consumers. Server workloads are MT driven and see here suddenly x86 doesn't look bad at all. As someone else mentioned it is entirley possible Ryzen has some basic power ovherhead making it look worse in ST. IO die for example? Or the much greater connectivity options like pcie lanes?

But then yes, stupid managment can ignore all that. entirely possible.
 
  • Like
Reactions: Space Tyrant

DisEnchantment

Golden Member
Mar 3, 2017
1,590
5,722
136
When you start putting the MTr in the charts it will paint a different picture.
MTr is a resource just like power.
[Perf/Clock -- Clock -- Area -- Power]
 
Last edited:
  • Like
Reactions: lightmanek

BorisTheBlade82

Senior member
May 1, 2020
660
1,003
106
@DisEnchantment
Sure, you do not mean the Performance-Power-Area triangle in which improving one leads to worsening another?
On that note I find it interesting that AMD now talks about PPA-C(ost). In the past, area was basically the same as cost but with foundries, chiplets and advanced packaging that seems to have changed quite a bit. Which is why area is not a straightforward measure to me any more. Transistor count is rather hard to obtain - at least for Intel.
 

DisEnchantment

Golden Member
Mar 3, 2017
1,590
5,722
136
Sure, you do not mean the Performance-Power-Area triangle in which improving one leads to worsening another?
Yes it is PPA. Just that people seems obsessed only with Perf/Clock and cannot see anything else.
Like you said it is very hard to even estimate this now. Not only cost is involved but availability. N5 is very dear, By 2022 TSMC will have only 3.5x wpm as on 2020 which is around 80-90 kwpm. Quite less to go around.
I am sure AMD would not make a 100mm2 CCD on N7 even if it means they can get 20% more perf. This simply means they cut N7 KGD output by a significant percentage. Shareholders will not be happy with less revenue.
Tiny dies clocked to the moon is what they want.
 
Last edited:

DrMrLordX

Lifer
Apr 27, 2000
21,582
10,785
136
What kind of (free) workload would you suggest?

There's a build of Handbrake in the 1.4x series that has NEON support that should work well on M1 SoCs. So long as you use encode settings that take hw acceleration out of the picture, it would be a fair benchmark.

Pretty sure you can get builds of Blender that support NEON as well.
 
  • Like
Reactions: lightmanek