Discussion PES | Assessing Power and Performance Efficiency of x86 CPU architectures

Page 2 - Seeking answers? Join the AnandTech community: where nearly half-a-million members share solutions and discuss the latest tech.

BorisTheBlade82

Senior member
May 1, 2020
663
1,014
106
Dear Community,

so this is my first thread here as a long-time lurker - but I felt the desire to share a small hobby-project of mine from the last couple of months with you...

Performance Efficiency Suite - What is it about?
Most Reviewers solely focus on what they consider to be the most important aspect of modern CPUs - the absolute performance. But this is only one side of the equation. Today Power Efficiency is at least as important - or to be more precise: The amount of energy (Wattseconds or Joules) a CPU needs in order to accomplish a given workload. Sadly most Reviewers shy away from the extra mile it needs to assess this aspect. This suite measures the Total Package Power of a CPU while running the Cinebench R23 benchmarks first in single-threaded mode (1 run), then running in multi-threaded mode (for 10 minutes + whatever it takes to finish the last run). The results will be rendered in the provided Results.xlsx Excel file. To combine Efficiency and Performance there is also a score provided called Performance Efficiency Score (how amazingly inspired I am ;)).

In the meantime I was able to aggregate more than 80 samples from members of the 3DC & CB communities (see below).

How-To
  1. Unzip the latest release to wherever you want EXCEPT on your local OneDrive folder.
  2. Open Settings.txt and insert your local Cinebench23 Directory.
  3. Run PES Start - it will ask for Administrator rights as these are needed for measuring Package Power
  4. Wait until the Powershell finishes.
  5. Open the Excel file...
  6. Allow external connections (to the generated CSV-files with the data)
  7. Go to Data -> Refresh all
  8. Enjoy and share your results - just take a screenshot of what the Excel renders.
  9. If you want to do multiple measurements with different settings just copy the Excel file (inside the root-folder) before running and refreshing the data.

Some explanations about the Suite
  • This Suite has been made possible by Michael Möller and his amazing free and open-source Open Hardware Monitor and his .NET Library OpenHardwareMonitorLib.dll - Thanks a lot!!!
    Homepage: https://openhardwaremonitor.org/
    GitHub: https://github.com/openhardwaremonitor
  • The results for the Package Power look pretty accurate compared to the sparse data the internet provides. Seems, that the vendors are much more honest with those sensors than they are with temperature etc.
  • The suite basically consists some powershell scripts and an Excel file for presentation purposes
    • RunAsAdminWrapper.ps1
      This is needed to have a convenient relative path shortcut in the root folder and request admin-rights at the same time
    • Main.ps1
      • After setting up some stuff it basically starts the Cinebench R23 one at a time. It then checks for the "Cinebench.exe" process being active.
      • While this is true it queries the Package Power Sensor data with a lower bound of 10ms (in order to keep CPU-load of the script at bay).
      • After each run the aquired data gets pushed to CSV files located in the LogCsv subfolder.
    • Results.xslx
      • The Excel file basically just does some import, calculations and a hopefully nice presentation of the data.
      • Histogram
        The bold line shows a running average of the last 100 data-points which should be sufficiently accurate. The pale line shows each single data-point.
      • Calculation of Total Package Consumption
        To get that number we need the integral. That is why we first calculate the timeframe between two data-points and then multiply the measured value.
      • Everything else in that Excel is hopefully more or less self-explaining

Online Resources

Disclaimer
I am by no means a Powershell professional or a professional Reviewer. I was just sick of the lack of information and wanted to propose a low-effort solution. Any input for further improvement is highly welcomed. Please feel free to use/extend/rip-off this solution as you wish. But please share your findings to the world.
 
Last edited:

JoeRambo

Golden Member
Jun 13, 2013
1,814
2,105
136
5950x pbo curve optimizer limited to 100w:
  • ST Efficiency Score = 89,92
  • MT Efficiency Score = 7516,68
1634010097330.png


5950x Hydra optimized to 100w:
  • ST Efficiency Score = 97,04
  • MT Efficiency Score = 8844,92

Great stuff, yet another reminder how mediocre stock and PBO settings are. Also how far things can be pushed with some know-how and tuning.
 

BorisTheBlade82

Senior member
May 1, 2020
663
1,014
106
So in general, what to make of all these numbers...

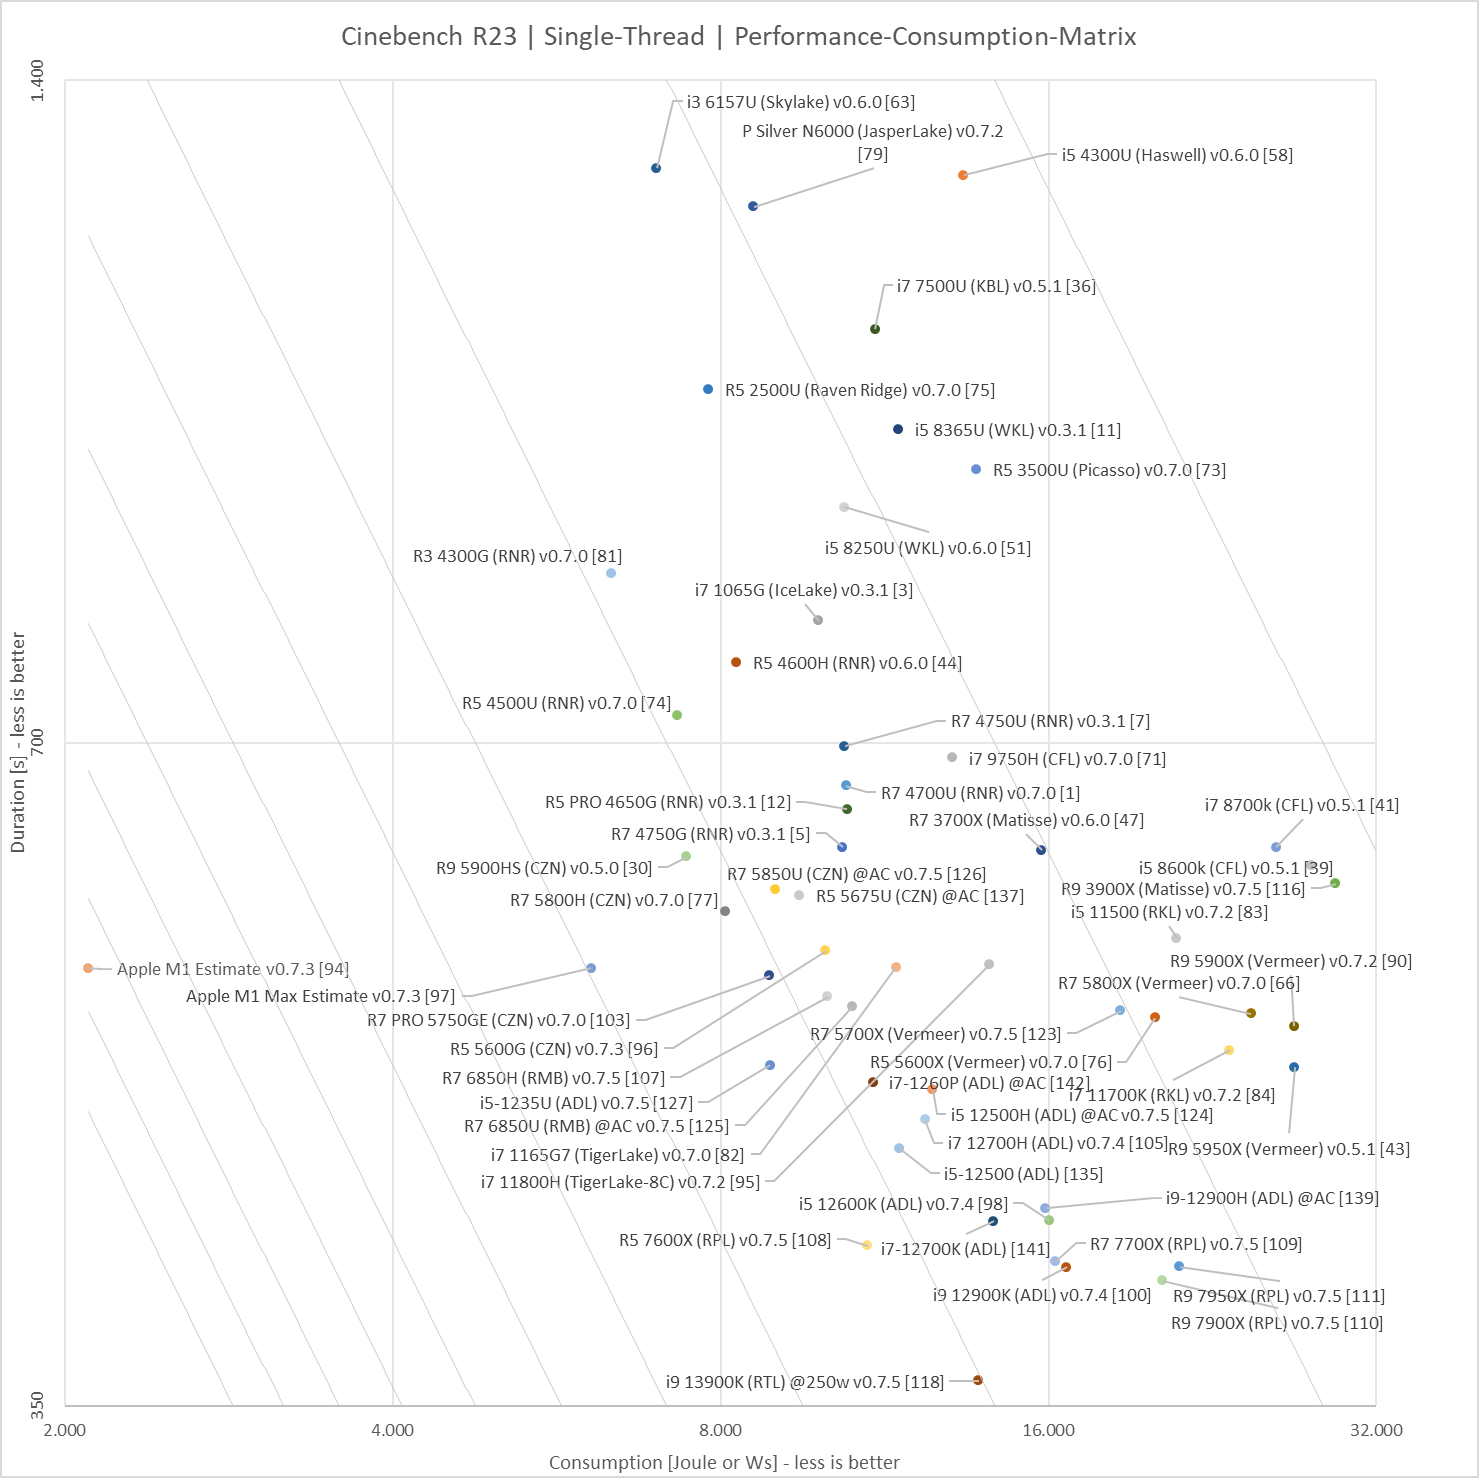
Let's have a look at the comparison between the Pentium Silver N6000 and the R3 4300G under ST for example as this should give us some nice clues regarding the underlying architecture and process:

CB_Perf_Power_ST.png


The former is the direct predecessor of the ADL little Gracemont core. The process is also 10nm - although more the variant ICL was released on and not the current 10ESF / Intel7.
When comparing to the latter it is clear to me how much better Zen2 and TSMC 7nm would work for a small core. Not only is the latter much much faster, it also is quite a lot more power efficient. So for Intel to catch up or overtake with Gracemont will be quite a stretch. For me it is very impressive how widely Zen2/3 scales. Although it is the best foundation for what we could call a "little" core it also works pretty well as a "big" core at the same time.

Too bad we can not directly compare the Apple M1. I guess the results would be devastating for the competition.
 

JoeRambo

Golden Member
Jun 13, 2013
1,814
2,105
136
The former is the direct predecessor of the ADL little Gracemont core. The process is also 10nm - although more the variant ICL was released on and not the current 10ESF / Intel7.

I think calling it "predecessor of Gracement" is giving WAY too much credit to previous Atom core. It was not meant to run workloads like CB at all. It is underpowered little core, behind the curve in power efficiency, good for minor integer workloads.
It has no machinery to properly run CB workload, and is meant to run Chromebook style of workloads at ARM SoC speeds.

Tremont:
1634378013040.png

vs this monster that has Skylake level of FP vec resources:

1634378100794.png

3x vec ALU, two symmetric FMUL/FADD capable pipes, backed by dual load / dual store.
 
Last edited:

BorisTheBlade82

Senior member
May 1, 2020
663
1,014
106
@JoeRambo
You are absolutely right. What you are pointing out leans more to the performance side of the equation. The question is what will happen wrt power efficiency. And there I do not expect miracles from 10ESF.
If we compare ICL and TGL we can see that 10SF helped with improving max frequency but not so much performance efficiency. Of course we would need a comparison with ISO frequency to be fair.
 
  • Like
Reactions: moinmoin

sallymander

Junior Member
Nov 20, 2020
12
30
61
Too bad we can not directly compare the Apple M1. I guess the results would be devastating for the competition.

I was actually trying to do this on my M1 Mac Mini. I got similar results to Andrei (about 3.8w package power average over the run) and the performance was about the same as the i7 1165G7 for ST. I think that gives an ST efficiency score of 800+ if I calculated it correctly.
 

mmaenpaa

Member
Aug 4, 2009
78
138
106
5600G @45W (set in bios, memory 3600MHz XMP, other settings at stock), fully passive (CPU that is) which begins to show in multi runs, build in progress picture below. PSU stays also passive with these loads (WAF requirement for living room ;))

1634402595561.png

1634402759205.png
 

BorisTheBlade82

Senior member
May 1, 2020
663
1,014
106
@sallymander
Yes, you are right. So let's call this an estimate:
According to several reviews (AT for example) the CB23 ST performance is practically identical to the 1165G. So let's take its 553 seconds and with the 3,8w from you and Andrei we have 2101Ws for the run. So we are looking at a PES of 860,7. That is total carnage for basically anyone else. I need to insert that into the x-y-chart because I think visually this is better to grasp. That is like NFL vs. High-school Football.

What is interesting is that M1 loses a lot of its relative advantage in MT.
If we take the 7833 points from Andrei we are looking at around 102s for one run (because approximately CB23 score = 800000 / duration in seconds).
So with 15w we get around 1530ws and a PES of “only" around 6400.
That is still only second to the 16c/32t 5950x but nevertheless a significant relative regression.
Here I an only speculate:
  • Icestorm is not so much an efficiency core for PPW but PPA.
  • At full load Icestorm is way beyond its perf-eff-sweet-spot as it was designed for light load (background tasks, low frequency and voltage).
  • Something entirely different.
 
Last edited:
  • Like
Reactions: Viknet and moinmoin

sallymander

Junior Member
Nov 20, 2020
12
30
61
@sallymander
Yes, you are right. So let's call this an estimate:
According to several reviews (AT for example) the CB23 ST performance is practically identical to th 1165G. So let's take its 553 seconds and with the 3,8w from you and Andrei we have 2101Ws for the run. So we are looking at a PES of 860,7. That is total carnage for basically anyone else. I need to insert that into the x-y-chart because I think visually this is better to grasp. That is like NFL vs. High-school Football.

What is interesting is that M1 loses a lot of its relative advantage in MT.
If we take the 7833 points from Andrei we are looking at around 102s for one run (because approximately CB23 score = 800000 / duration in seconds).
So with 15w we get around 1530ws and a PES of “only" around 6400.
That is still only second to the 16c/32t 5950x but nevertheless a significant relative regression.
Here I an only speculate:
  • Icestorm is not so much an efficiency core for PPW but PPA.
  • At full load Icestorm is way beyond its perf-eff-sweet-spot as it was designed for light load (background tasks, low frequency and voltage).
  • Something entirely different.

I'll see if I can do some MT testing too. I wonder if Ryzen has some fixed overheads (RAM?) that are much lower on the M1, making the Ryzen ST look worse.
 
  • Like
Reactions: BorisTheBlade82

BorisTheBlade82

Senior member
May 1, 2020
663
1,014
106
@BorisTheBlade82

Great work here. Thanks for your effort. How are you computing efficiency? I assume multiplying total power x time?
Well, basically sampling package power as often as possible and then calculating the integral (Joule or Wattseconds). Because this is what it is about with a fixed workload: How much energy is needed to work it through?
 

Hulk

Diamond Member
Oct 9, 1999
4,214
2,005
136
Well, basically sampling package power as often as possible and then calculating the integral (Joule or Wattseconds). Because this is what it is about with a fixed workload: How much energy is needed to work it through?

Got it. Calculating the area under the power vs. time function. Smart. You say calculating the integral. Are you finding a function for the curve and then integrating or using the trapezoidal rule with a definite number of values for "n?" Just wondering because you mentioned the integral. Not sure if you meant that to mean calculating the area under the curve numerically or closed solution with the function between to bounds, that's why I'm asking. Just curious.

You could also take the average power during the run and multiply it by the time of the run and get the same result right?
 
  • Like
Reactions: BorisTheBlade82

BorisTheBlade82

Senior member
May 1, 2020
663
1,014
106
To be precise this is of course a discretized integral. I am gathering the package power samples and multiply it with the amount of time between two samples. Average power only works for very uniform data. With PL1, PL2 and stuff this just does not cut it in order to be accurate.
 
  • Like
Reactions: Hulk

Hulk

Diamond Member
Oct 9, 1999
4,214
2,005
136
To be precise this is of course a discretized integral. I am gathering the package power samples and multiply it with the amount of time between two samples. Average power only works for very uniform data. With PL1, PL2 and stuff this just does not cut it in order to be accurate.

Understood. By average power I meant adding the power values sampled and then dividing by the total number of samples. Of course this is ultimately the same thing you are doing though.

Thanks for responding. I'm curious as to the sampling rate?

Finally, as you wrote with all of the opportunistic frequency manipulation of modern CPU's it is also very difficult to nail down frequency during a benchmark run. Is the data available to sample the frequency of each core as well? The total of all of these samples, divided by the total number of samples would provide an average clock speed during the benchmark run, which would be very interesting as it would allow IPC, or "throughput" for each core architecture and more insight into the results.

HWinfo provide a data point like this and they call it "average effective clock."

I'm sorry if I'm being that guy who has to ask someone who is doing something out of the goodness of their heart, donating time and intellect to the community to do additional work!!! Your effort is extremely appreciated!