Question Handbrake 1.3.3 - Benchmark your System - COMPLETE Overhaul of the test

Page 3 - Seeking answers? Join the AnandTech community: where nearly half-a-million members share solutions and discuss the latest tech.

Hulk

Diamond Member
Oct 9, 1999
5,079
3,575
136
A little background...
Handbrake is a ubiquitous encoding application and happens to be one that makes good use of multicore/thread CPU's when encoding x265. x265 is a widely used and efficient compression scheme that requires significant compute to encode. While hardware encoders are faster, at the same bitrates, CPU (software) encode produces better video quality. Of course this assumes the use of lower bitrates as quality for both hardware and software encodes will be indistinguishable at higher bitrates. But the point of the video encode is to get good quality at low bitrates so we are therefore testing software encode.

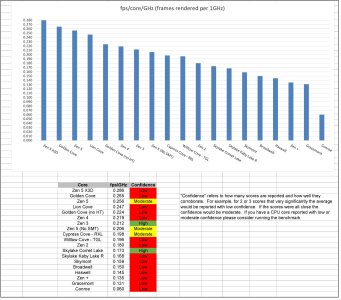
fps/GHz/core is a representation of how efficient a given CPU core is at encoding the test file using the x265 format. The number is arrived at by multiplying the number of physical cores by the average frequency they are running at and then dividing by the fps from the Handbrake test. It tells us for a given core how many fps can this core encode the test if it was running at 1GHz. We could consider this an "IPC" of sorts for this test but strictly speaking this would be closer to the word "throughput." And as you know many around here are indeed strict with terminology so I will avoid the word IPC at it denotes Instructions Per Cycle and that is not actually what we are measuring.

Some people will go "all out" and try and run their system as close to the limit as possible and others (like me) just run at stock. All of the data is valuable and informative as long as it is collected from each person in the same manner and there for comparable.

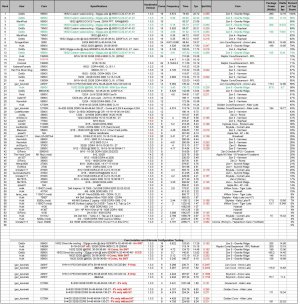
I went through all of the results and created a new table. In respecting everyone's time who participated in the old data I am keeping that data on the 2nd page of this post.

Here's the test file: https://4kmedia.org/lg-new-york-hdr-uhd-4k-demo/


1. Use the following version of Handbrake with the built-in h.265 mkv 2160p60 preset
HandBrake-1.3.3-x86_64-Win_GUI.exe
Don't forget to turn on logging in Handbrake so you can retrieve your time. Tools>Preferences>Advanced>Logging
Once this current version is replaced you'll be able to access this version from the following link.
HandBrake: Nightly Builds
Nightly builds of HandBrake
handbrake.fr

2. Report your encoding time, average CPU frequency, and Package Power. If you have a hybrid CPU you can turn off the E's in the BIOS. For E testing turn off all P's except one in the BIOS, clock it down to 800MHz, and then shut it down with Process Lasso. Or just report your score with 1 P at 800MHz and let me know you did that so I can subtract out that P core's (minor) contribution to the encode.

Here's how to report your average clock and package power so we are all doing it the same way.
Handbrake does some housekeeping right after you start encode and when the progress bar gets to 100%.
This could result in lower than actual average clock.
After you start the encode, wait a few seconds until you see the green Handbrake bar appear, then reset the HWinfo counter.
At the end don't wait to grab the screen shot at 100%, just do it sometime after about 95%.

3. CPU Model, and RAM specs
 

Attachments

  • Handbrake.chart.jpg
    Handbrake.chart.jpg
    581.4 KB · Views: 36
  • Handbrake.new.jpg
    Handbrake.new.jpg
    1.2 MB · Views: 26
Last edited:

Det0x

Golden Member
Sep 11, 2014
1,421
4,812
136
encoded 1806 frames in 170.24s (10.61 fps), 11820.04 kb/s, Avg QP:29.09

Average Effective Clock screenshot at 93% done.

Which " average " column number you want ... is questionable....
Averages ... of averages ... are not accurate.

This test is not pushing the limits of this chip.

I'm expecting an ALL core OC of 4.65 GHz
( not testing yet )
Will submit when All Core found.

( this is a BOOST score )

Look what i have highlighted in this picture:

We need average effective clocks. Restart timers/sensors in hwinfo when you have started the benchmark and take screenshot 1-3 seconds before it finishes.
 

Noid

Platinum Member
Sep 20, 2000
2,390
193
106
OPEN YOUR EYES ... ITS IN MY SCREENSHOT
( my previous screenshot also has it - but after 100 completion)
I did not see any requirement for 100 percent screenshot.

I'm currently seeking my All Core OC.

If this is not good enough ... then I am done lol.

Oh, you are rejecting my numbers because they are not highlighted ? Ok ... fine lol
 
Last edited:

Hulk

Diamond Member
Oct 9, 1999
5,079
3,575
136
encoded 1806 frames in 170.24s (10.61 fps), 11820.04 kb/s, Avg QP:29.09

Average Effective Clock screenshot at 93% done.

Which " average " column number you want ... is questionable....
Averages ... of averages ... are not accurate.

This test is not pushing the limits of this chip.

I'm expecting an ALL core OC of 4.65 GHz
( not testing yet )
Will submit when All Core found.

( this is a BOOST score )

Thanks! That's perfect. I added your score to the table. Those Zen 3's really crush Handbrake.

From what I understand from my reading of "Average Effective Clock" it's not an average of an average. From the following link:


"It has become a common practice for several years to report instant (discrete) clock values for CPUs. This method is based on knowledge of the actual bus clock (BCLK) and sampling of core ratios at specific time points. The resulting clock is then a simple result of ratio * BCLK. Such approach worked quite well in the past, but is not longer sufficient. Over the years CPUs have become very dynamic components that can change their operating parameters hundreds of times per second depending on several factors including workload amount, temperature limits, thermal/VR current and power limits, turbo ratios, dynamic TDPs, etc. While this method still represents actual clock values and ratios reported match defined P-States, it has become insufficient to provide a good overview of CPU dynamics especially when parameters are fluctuating with a much higher frequency than any software is able to capture. Another disadvantage is that cores in modern CPUs that have no workload are being suspended (lower C-States). In such case when software attempts to poll their status, it will wake them up briefly and thus the clock obtained doesn't respect the sleeping state.

Hence a new approach needs to be used called the Effective clock. This method relies on hardware's capability to sample the actual clock state (all its levels) across a certain interval, including sleeping (halted) states. The software then queries the counter over a specific polling period, which provides the average value of all clock states that occurred in the given interval. HWiNFO v6.13-3955 Beta introduces reporting of this clock.
Many users might be surprised how different this clock is in comparison to the traditional clock values reported. But please note that this effective value is the average clock across the polling interval used in HWiNFO. "
 

Noid

Platinum Member
Sep 20, 2000
2,390
193
106
All core results in 5 more hours hopefully.
4.6 Ghz at 1.35v - - 2.5 hrs. of P95 passed so far ...

Wish I could remove core 17 and 18
( I think 4.7 then .... )
 

Noid

Platinum Member
Sep 20, 2000
2,390
193
106
encoded 1806 frames in 157.92s (11.44 fps), 11820.04 kb/s, Avg QP:29.09

All core 4.6GHz @ 1.35v
2 x 16 = 32 GB Cas18

clock numbers in screenshot
( not sure what column you want )

P95 utilization at 99.8 percent
So, this is a walk in the park.

This does produce alot of heat.
( good to test with )
Although I have 20C --- 3 second spikes in temperature
My P95 sits at 78C in " current " status most of the time.
Average temp over 8 hours of p95 was 79C.

I could probably get a temporary all core OC of 4.8Ghz if you are curious ...
( not p95 stable of course )
 

Attachments

  • AllCore_4.6Ghz.JPG
    AllCore_4.6Ghz.JPG
    574.4 KB · Views: 20
Last edited:

Hulk

Diamond Member
Oct 9, 1999
5,079
3,575
136
encoded 1806 frames in 157.92s (11.44 fps), 11820.04 kb/s, Avg QP:29.09

All core 4.6GHz @ 1.35v
2 x 16 = 32 GB Cas18

clock numbers in screenshot
( not sure what column you want )

P95 utilization at 99.8 percent
So, this is a walk in the park.

This does produce alot of heat.
( good to test with )
Although I have 20C --- 3 second spikes in temperature
My P95 sits at 78C in " current " status most of the time.
Average temp over 8 hours of p95 was 79C.

I could probably get a temporary all core OC of 4.8Ghz if you are curious ...
( not p95 stable of course )

Your system is scaling quite linearly. I find it interesting that the best AMD systems are just below 4GHz Effective Average Clock while the fastest Intel are just below 5GHz. The clock difference reported by other means such as average clock in HWinfo, CPUz, or Task Manager show the AMD and Intel clocks to be much closer. Something is going on there.
 

Det0x

Golden Member
Sep 11, 2014
1,421
4,812
136
Cant seem to beat XabanakFanatik's static OC with PBO+CO, but i'm getting closer, happy with the singlethread performance tho :)

handbreak1 15.22 fps.png


encoded 1806 frames in 118.67s (15.22 fps), 11820.04 kb/s, Avg QP:29.09
[23:55:12] mux: track 0, 1806 frames, 106742176 bytes, 11814.30 kbps, fifo 512
[23:55:12] mux: track 1, 3385 frames, 1365514 bytes, 151.14 kbps, fifo 1024
[23:55:12] Finished work at: Wed Dec 30 23:55:12 2020
[23:55:12] libhb: work result = 0

Average effective clock = 3959mhz
Average totalt cpu usage = 82,5%
 
  • Like
Reactions: Hulk and IEC

Mir96TA

Golden Member
Oct 21, 2002
1,950
37
91
Here is a 3500X with MSi B350 TomoHawk pair up G.Skillz AGES 3000 16 18 18 38 56 1T
encoded 1806 frames in 477.40s (3.78 fps), 11820.04 kb/s, Avg QP:29.0
Average Effective Clock 5006.7 [MHz]

HandBrake-3500X.jpg
 
Last edited:

Hulk

Diamond Member
Oct 9, 1999
5,079
3,575
136
Here is a 3500X with MSi B350 TomoHawk pair up G.Skillz AGES 3000 16 18 18 38 56 1T
encoded 1806 frames in 477.40s (3.78 fps), 11820.04 kb/s, Avg QP:29.0
Average Effective Clock 5006.7 [MHz]

View attachment 38459

Thanks for running the test. You have to reset the stopwatch as soon as Handbrake starts encoding and then take the screen shot right before the end of the test, at like 98%. If you do that I can get the average effective clock and cpu usage values that are comparable with the other results in the results table.
 

Mir96TA

Golden Member
Oct 21, 2002
1,950
37
91
HandBrake 1.3.3 (2020061300)
OS: Microsoft Windows NT 10.0.19042.0
CPU: AMD Ryzen 7 2700 Eight-Core Processor
MB Gigabyte B450 Aorus Pro WiFi
GPU Information:
Radeon (TM) RX 480 Graphics
Average Effective Clock 355.632
encoded 1806 frames in 500.82s (3.61 fps), 11820.04 kb/s, Avg QP:29.09
Stock AKA No O.C.
2700 is a Tad bit faster. ?
HWinfo.JPG
1611457976434.png


Hulk

Diamond Member
Oct 9, 1999
5,079
3,575
136
HandBrake 1.3.3 (2020061300)
OS: Microsoft Windows NT 10.0.19042.0
CPU: AMD Ryzen 7 2700 Eight-Core Processor
MB Gigabyte B450 Aorus Pro WiFi
GPU Information:
Radeon (TM) RX 480 Graphics
Average Effective Clock 355.632
encoded 1806 frames in 500.82s (3.61 fps), 11820.04 kb/s, Avg QP:29.09
Stock AKA No O.C.
2700 is a Tad bit faster. ?
View attachment 38504
View attachment 38505


Of course, family always comes first.

Your Average Effective Clock was 3193, not 355. You can see it in the HWinfo on the screenshot. The Average CPU Usage was not in the screenshot but I posted your result anyway as that info isn't as important. I think that number is a little farther down the HWinfo window.
 

Makaveli

Diamond Member
Feb 8, 2002
4,912
1,501
136
Ryzen 5800X 16GB DDR4 @ 3200 14-14-13-28 1T
Windows 20H2 HB 1.3.3
encoded 1806 frames in 239.83s (7.53 fps), 11820.04 kb/s, Avg QP:29.09

zen timing2.PNG

Handbreak anandtech bench.png
 
Last edited:

Det0x

Golden Member
Sep 11, 2014
1,421
4,812
136
One thing i've noticed with this benchmark is how differently the allcore (effective clock) boosting behave compared to all other benchmarks.

In this benchmark all cores run at their own different effective clock, while in all other benchmarks i have tested they all run at the same clock.
Why is that ?

Some examples:
blender.pngcinebench.pngcpu-z.pngIBT.pngprime95 without AVX.png
 

Hulk

Diamond Member
Oct 9, 1999
5,079
3,575
136
One thing i've noticed with this benchmark is how differently the allcore (effective clock) boosting behave compared to all other benchmarks.

In this benchmark all cores run at their own different effective clock, while in all other benchmarks i have tested they all run at the same clock.
Why is that ?

Some examples:
View attachment 39171View attachment 39172View attachment 39173View attachment 39174View attachment 39175


If the other programs you are referring to are benchmarks they may not have core-to-core dependencies that most actual applications have.
 

Noid

Platinum Member
Sep 20, 2000
2,390
193
106
edit
opps - I cheated
( got my input / output files mixed up )
sorry - nothing better now
 
Last edited:

brinstar117

Senior member
Mar 28, 2001
954
4
91
Intel Xeon E5-2673v4 (Broadwell 20 core w/ hyperthreading)
4x16GB Samsung M391A2K43BB1-CPB DDR4-2133 ECC 15-15-15-36 (quad channel)
encoded 1806 frames in 271.47s (6.65 fps), 11820.04 kb/s, Avg QP:29.09
1800MHz average effective CPU clock speed
Average CPU usages 74.5%

Average effective CPU clock.png

Average CPU usages.png

encode time.PNG
 
  • Like
Reactions: lightmanek

Arni90

Junior Member
Apr 7, 2021
7
12
51
Here's an 11900K running at (quite toasty) 5.2 GHz AVX, or 4.8 GHz with AVX512
8.24 fps
Average effective frequency was reported as 4815.3 MHz by HWiNFO64 just after finishing the benchmark

Skjermbilde (67).png
 

Attachments

  • Skjermbilde (66).png
    Skjermbilde (66).png
    1.5 MB · Views: 8