Hulk
Diamond Member
A little background...
Handbrake is a ubiquitous encoding application and happens to be one that makes good use of multicore/thread CPU's when encoding x265. x265 is a widely used and efficient compression scheme that requires significant compute to encode. While hardware encoders are faster, at the same bitrates, CPU (software) encode produces better video quality. Of course this assumes the use of lower bitrates as quality for both hardware and software encodes will be indistinguishable at higher bitrates. But the point of the video encode is to get good quality at low bitrates so we are therefore testing software encode.
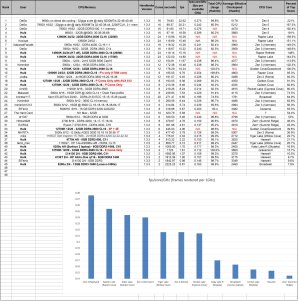
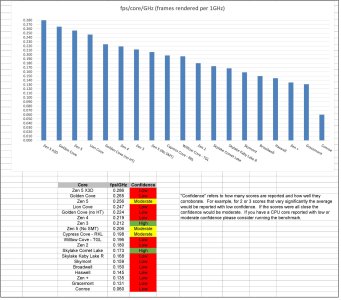
fps/GHz/core is a representation of how efficient a given CPU core is at encoding the test file using the x265 format. The number is arrived at by multiplying the number of physical cores by the average frequency they are running at and then dividing by the fps from the Handbrake test. It tells us for a given core how many fps can this core encode the test if it was running at 1GHz. We could consider this an "IPC" of sorts for this test but strictly speaking this would be closer to the word "throughput." And as you know many around here are indeed strict with terminology so I will avoid the word IPC at it denotes Instructions Per Cycle and that is not actually what we are measuring.
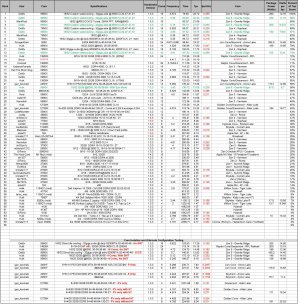
Some people will go "all out" and try and run their system as close to the limit as possible and others (like me) just run at stock. All of the data is valuable and informative as long as it is collected from each person in the same manner and there for comparable.
I went through all of the results and created a new table. In respecting everyone's time who participated in the old data I am keeping that data on the 2nd page of this post.
Here's the test file: https://4kmedia.org/lg-new-york-hdr-uhd-4k-demo/
1. Use the following version of Handbrake with the built-in h.265 mkv 2160p60 preset
HandBrake-1.3.3-x86_64-Win_GUI.exe
Don't forget to turn on logging in Handbrake so you can retrieve your time. Tools>Preferences>Advanced>Logging
Once this current version is replaced you'll be able to access this version from the following link.
HandBrake: Nightly Builds
Nightly builds of HandBrake
handbrake.fr
2. Report your encoding time, average CPU frequency, and Package Power. If you have a hybrid CPU you can turn off the E's in the BIOS. For E testing turn off all P's except one in the BIOS, clock it down to 800MHz, and then shut it down with Process Lasso. Or just report your score with 1 P at 800MHz and let me know you did that so I can subtract out that P core's (minor) contribution to the encode.
Here's how to report your average clock and package power so we are all doing it the same way.
Handbrake does some housekeeping right after you start encode and when the progress bar gets to 100%.
This could result in lower than actual average clock.
After you start the encode, wait a few seconds until you see the green Handbrake bar appear, then reset the HWinfo counter.
At the end don't wait to grab the screen shot at 100%, just do it sometime after about 95%.
3. CPU Model, and RAM specs
Handbrake is a ubiquitous encoding application and happens to be one that makes good use of multicore/thread CPU's when encoding x265. x265 is a widely used and efficient compression scheme that requires significant compute to encode. While hardware encoders are faster, at the same bitrates, CPU (software) encode produces better video quality. Of course this assumes the use of lower bitrates as quality for both hardware and software encodes will be indistinguishable at higher bitrates. But the point of the video encode is to get good quality at low bitrates so we are therefore testing software encode.
fps/GHz/core is a representation of how efficient a given CPU core is at encoding the test file using the x265 format. The number is arrived at by multiplying the number of physical cores by the average frequency they are running at and then dividing by the fps from the Handbrake test. It tells us for a given core how many fps can this core encode the test if it was running at 1GHz. We could consider this an "IPC" of sorts for this test but strictly speaking this would be closer to the word "throughput." And as you know many around here are indeed strict with terminology so I will avoid the word IPC at it denotes Instructions Per Cycle and that is not actually what we are measuring.
Some people will go "all out" and try and run their system as close to the limit as possible and others (like me) just run at stock. All of the data is valuable and informative as long as it is collected from each person in the same manner and there for comparable.
I went through all of the results and created a new table. In respecting everyone's time who participated in the old data I am keeping that data on the 2nd page of this post.
Here's the test file: https://4kmedia.org/lg-new-york-hdr-uhd-4k-demo/
1. Use the following version of Handbrake with the built-in h.265 mkv 2160p60 preset
HandBrake-1.3.3-x86_64-Win_GUI.exe
Don't forget to turn on logging in Handbrake so you can retrieve your time. Tools>Preferences>Advanced>Logging
Once this current version is replaced you'll be able to access this version from the following link.
HandBrake: Nightly Builds
Nightly builds of HandBrake
handbrake.fr
2. Report your encoding time, average CPU frequency, and Package Power. If you have a hybrid CPU you can turn off the E's in the BIOS. For E testing turn off all P's except one in the BIOS, clock it down to 800MHz, and then shut it down with Process Lasso. Or just report your score with 1 P at 800MHz and let me know you did that so I can subtract out that P core's (minor) contribution to the encode.
Here's how to report your average clock and package power so we are all doing it the same way.
Handbrake does some housekeeping right after you start encode and when the progress bar gets to 100%.
This could result in lower than actual average clock.
After you start the encode, wait a few seconds until you see the green Handbrake bar appear, then reset the HWinfo counter.
At the end don't wait to grab the screen shot at 100%, just do it sometime after about 95%.
3. CPU Model, and RAM specs
Attachments
Last edited: