- May 28, 2009
- 555
- 2
- 71
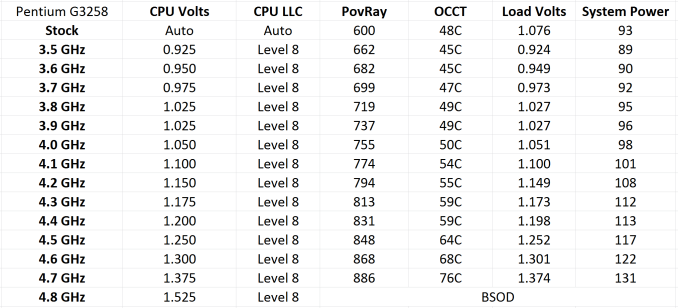
Gleaned from Anandtech and condensed into one graph are the results from Crashtech's G3258 overclocking notes, Ian Cutress' write-up on the Pentium Anniversary Edition as well as my own testing.
All three use aftermarket cooling. Measured Vcore may differ by plus/minus 5 mV from the set values used here.
Updates will likely include more and more 'graphic' images of temperature, power consumption as well as sources.

I will also gladly include your data to get an even more representative sample. (Even a single fine-tuned stable voltage data point would be appreciated. Fine tuned means, 5 mV below which the CPU is unstable, 4.2 GHz seems like a reasonable target.)
Update 1.1
One of the constant questions that comes up during OC'ing is by how much one should increase voltage, going from one multiplier to the next. After some rather blind trial and error testing, it seems that 5 mV steps are still a little wide especially at lower clocks. Units were taken down a notch from 0.005 V to 5 Millivolts [mV] to not have to write zeros. This second chart shows all subsequent voltage jumps I had to set starting from 0.860 V @32x going up by 20 mV to 0.880 V @33x.

It is apparent that the voltage jumps need to be subsequently increasing to keep the overclock stable. With finer grained testing the graph would likely resemble a perfect stairway. To get an idea of the incline, a trend line is drawn. The equation of the trend line suggests that starting with 15 the voltage jumps should increase by exactly 3 mV. So the steps should be 18 mV; 21; 24; 27, 30 and so forth. 3 mV adjustments seem definitely preferable to the somewhat arbitrary 5 and 25 mV steps, at least for my rig. CPUs as well as cooling solutions have a range of properties and and thusly have different graphs/slopes. Still, further testing shows that the Haswell's FIVR doesn't allow finer grained VCore adjustments, than 4 or 5 mV, the voltage always ends up at the closest default value. For further graphs measured Vcore, rather then set values should be used.
Side note: The trend line equation treats the X-axis as if it were just integer steps, rather than the actual clock rate of 3'200'000'000 Hz.
Second side note: In terms of differential calculus, working out the voltage delta in 100 MHz intervals is a crude way to approximate the first derivation of the original graph. Should this first derivation be linear, as was assumed with the trend line, then the original chart is likely a parabola of sorts, with a formula of: voltage equals something something [frequency] squared.
Power Consumption
Higher clock rate and voltage directly raises power consumption, which is measured with a simple and imprecise watt-meter. Getting up there past 4.4 GHz, it takes considerable power consumption boosts of more than 10% to get a modest 2.2 % performance increase. However power consumption barely matters when using Speedstep and adaptive voltage, as these high states are rarely reached during normal use, but running the highest possible overclock will force the CPU fan to audibly speed up, which may be annoying. So 4.3 GHz looks like good middle ground.

A Simple Experiment
I always wanted to do this little experiment. I was surprised just by how neat the results were. Maybe you can figure it out.

Update 1.2 - Offset Undervolting
Having looked at Vcore and and at the Vcore differential above base frequency, the only remaining unknowns are voltages between 800 and 3200 MHz. During testing I was surprised to see Vcore go way, way down to 0.477 V in completely steady fashion.
Also stock Speedstep voltages have been recorded by forcing lower power states with Windows Power Management. Intel's Speedstep, which is basically power management by way of reducing voltage and frequency, only uses 15 out of the 25 multipliers available.

If using [variable frequency] and [adaptive voltage] an overclock of, say [4.3 GHz] is set, this overclock state becomes (100%) CPU state while the stock speed of 3.2 GHz becomes (99%), I guess "%" only means that the scale goes up to a 100.
There is a huge gap between stock voltages and the smallest stable voltage the CPU actually requires, and this gap only widens when the CPU speed is reduced.

So for people who were worried that setting a big negative offset might make their system unstable, you needn't fret, the differences get higher, the lowest power states are very much overvolted. My magic number for the offset is "minus 0.183 V" which is exactly the difference between stock and stable at 3.2 GHz.
This offset across the full frequency range is probably more important than the overclock voltage, it saves power while the CPU is idle during video playback and other generally predictable and less demanding tasks, basically most of the time.
There is also a whole lot more going on in this graph, you see voltage being linear at stock frequencies, while in the overclocking range the graph is visibly bent. Somewhat exaggerated with a kink here because only 4.3 GHz is used, in the graph that only shows actual Speedstep states.
So comparing the default and overclocking clock ranges we see different voltage behavior. How it changes and what makes it change will be subject of the next update.
Update 1.3
It took about two A4 pages of tightly written stress testing results, to record the minimal voltages across the entire achievable frequency range. This is the natural, CPU Voltage-Frequency-Curve for a 4th Generation-Haswell Pentium G3258 Anniversary Edition. This curve is unedited except for a highlighted spot, at which it stops being linear and starts to bend upwards, which is discussed in a follow-up topic.

Rather than measuring power at the wall wart it's probably much easier to rely on the Package Power reported by the CPU. Also isn't it quite cool to see an desktop CPU consume 24 W during heavy OCCT stress testing. Thanks to a 80plus platinum rated (230 VAC) power supply, mini-ITX board, 1.25V DDR3 and undervolting, this is probably the lowest idle power (20 W) you can get on a desktop PC with discrete graphics (750 ti). Granted lowest idle power and silence were the primary goals with component selection. This rig also includes an additional 2.5" HDD, because unlike 3.5" drives they are nearly inaudible during operation.

All three use aftermarket cooling. Measured Vcore may differ by plus/minus 5 mV from the set values used here.
Updates will likely include more and more 'graphic' images of temperature, power consumption as well as sources.
I will also gladly include your data to get an even more representative sample. (Even a single fine-tuned stable voltage data point would be appreciated. Fine tuned means, 5 mV below which the CPU is unstable, 4.2 GHz seems like a reasonable target.)
Update 1.1
One of the constant questions that comes up during OC'ing is by how much one should increase voltage, going from one multiplier to the next. After some rather blind trial and error testing, it seems that 5 mV steps are still a little wide especially at lower clocks. Units were taken down a notch from 0.005 V to 5 Millivolts [mV] to not have to write zeros. This second chart shows all subsequent voltage jumps I had to set starting from 0.860 V @32x going up by 20 mV to 0.880 V @33x.
It is apparent that the voltage jumps need to be subsequently increasing to keep the overclock stable. With finer grained testing the graph would likely resemble a perfect stairway. To get an idea of the incline, a trend line is drawn. The equation of the trend line suggests that starting with 15 the voltage jumps should increase by exactly 3 mV. So the steps should be 18 mV; 21; 24; 27, 30 and so forth. 3 mV adjustments seem definitely preferable to the somewhat arbitrary 5 and 25 mV steps, at least for my rig. CPUs as well as cooling solutions have a range of properties and and thusly have different graphs/slopes. Still, further testing shows that the Haswell's FIVR doesn't allow finer grained VCore adjustments, than 4 or 5 mV, the voltage always ends up at the closest default value. For further graphs measured Vcore, rather then set values should be used.
Side note: The trend line equation treats the X-axis as if it were just integer steps, rather than the actual clock rate of 3'200'000'000 Hz.
Second side note: In terms of differential calculus, working out the voltage delta in 100 MHz intervals is a crude way to approximate the first derivation of the original graph. Should this first derivation be linear, as was assumed with the trend line, then the original chart is likely a parabola of sorts, with a formula of: voltage equals something something [frequency] squared.
Power Consumption
Higher clock rate and voltage directly raises power consumption, which is measured with a simple and imprecise watt-meter. Getting up there past 4.4 GHz, it takes considerable power consumption boosts of more than 10% to get a modest 2.2 % performance increase. However power consumption barely matters when using Speedstep and adaptive voltage, as these high states are rarely reached during normal use, but running the highest possible overclock will force the CPU fan to audibly speed up, which may be annoying. So 4.3 GHz looks like good middle ground.
A Simple Experiment
I always wanted to do this little experiment. I was surprised just by how neat the results were. Maybe you can figure it out.
Update 1.2 - Offset Undervolting
Having looked at Vcore and and at the Vcore differential above base frequency, the only remaining unknowns are voltages between 800 and 3200 MHz. During testing I was surprised to see Vcore go way, way down to 0.477 V in completely steady fashion.
Also stock Speedstep voltages have been recorded by forcing lower power states with Windows Power Management. Intel's Speedstep, which is basically power management by way of reducing voltage and frequency, only uses 15 out of the 25 multipliers available.
If using [variable frequency] and [adaptive voltage] an overclock of, say [4.3 GHz] is set, this overclock state becomes (100%) CPU state while the stock speed of 3.2 GHz becomes (99%), I guess "%" only means that the scale goes up to a 100.
There is a huge gap between stock voltages and the smallest stable voltage the CPU actually requires, and this gap only widens when the CPU speed is reduced.
So for people who were worried that setting a big negative offset might make their system unstable, you needn't fret, the differences get higher, the lowest power states are very much overvolted. My magic number for the offset is "minus 0.183 V" which is exactly the difference between stock and stable at 3.2 GHz.
This offset across the full frequency range is probably more important than the overclock voltage, it saves power while the CPU is idle during video playback and other generally predictable and less demanding tasks, basically most of the time.
There is also a whole lot more going on in this graph, you see voltage being linear at stock frequencies, while in the overclocking range the graph is visibly bent. Somewhat exaggerated with a kink here because only 4.3 GHz is used, in the graph that only shows actual Speedstep states.
So comparing the default and overclocking clock ranges we see different voltage behavior. How it changes and what makes it change will be subject of the next update.
Update 1.3
It took about two A4 pages of tightly written stress testing results, to record the minimal voltages across the entire achievable frequency range. This is the natural, CPU Voltage-Frequency-Curve for a 4th Generation-Haswell Pentium G3258 Anniversary Edition. This curve is unedited except for a highlighted spot, at which it stops being linear and starts to bend upwards, which is discussed in a follow-up topic.
Rather than measuring power at the wall wart it's probably much easier to rely on the Package Power reported by the CPU. Also isn't it quite cool to see an desktop CPU consume 24 W during heavy OCCT stress testing. Thanks to a 80plus platinum rated (230 VAC) power supply, mini-ITX board, 1.25V DDR3 and undervolting, this is probably the lowest idle power (20 W) you can get on a desktop PC with discrete graphics (750 ti). Granted lowest idle power and silence were the primary goals with component selection. This rig also includes an additional 2.5" HDD, because unlike 3.5" drives they are nearly inaudible during operation.
Last edited: