Decided to put together a few links I've read from 538 website on how they recommend interpreting polls:
Pollster House Effect:
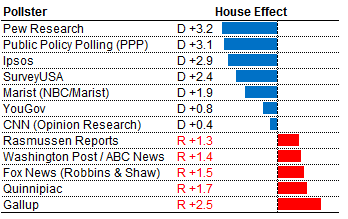
http://fivethirtyeight.blogs.nytimes.com/2012/06/22/calculating-house-effects-of-polling-firms/
State Home Court Advantage:
Historical Monthly Jobs Report correlations:
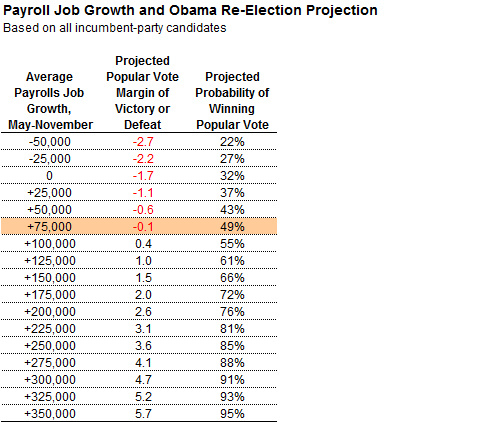
http://fivethirtyeight.blogs.nytimes.com/2012/05/04/has-obamas-magic-jobs-number-changed/
Caveats:
- Skewed seasonal adjustment factor?: http://ftalphaville.ft.com/blog/2012/07/06/1074731/seasonality-and-jobs-one-more-time/
- Unemployment rate by Education Attained: http://www.bls.gov/web/empsit/cpseea05.htm
- Unemployment rate by Race / Sex: http://www.bls.gov/cps/cpsaat07.htm
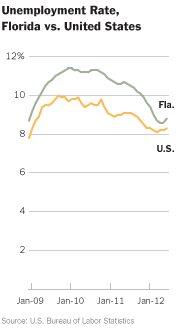
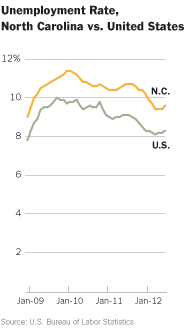
- Most true swing states, except Florida and Nevada I believe, have unemployment rates well below national average and IIRC Nevada's rate is falling fast, though it started from very high level
- Morningstar economist Bob Johnson says seasonally adjusted monthly jobs gains have been about 150K on average for first 6 months. He sees modest acceleration of economy in second half and monthly jobs gains accelerating in particular because of new home starts tailwind (construction workers getting hired. e. g. IIRC, Toll Brothers recently said they are seeing shortage of construction workers in some markets, and they see strength in all markets across country they serve. I forgot exact number, but I think he said around 175K per month was his guess) http://www.morningstar.com/cover/videocenter.aspx?id=563032
Disingenuous Outliers?:
http://fivethirtyeight.blogs.nytimes.com/2012/08/28/aug-27-michigan-isnt-a-tossup/
Seven Ways to Read a Poll:
http://fivethirtyeight.blogs.nytimes.com/2012/08/24/aug-23-seven-ways-to-evaluate-a-poll/
Pollster House Effect:
http://fivethirtyeight.blogs.nytimes.com/2012/06/22/calculating-house-effects-of-polling-firms/
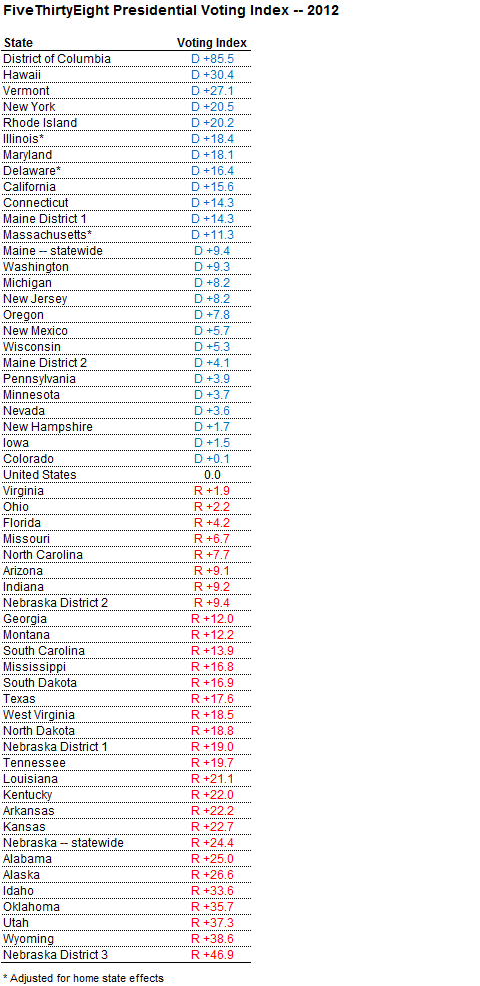
State Home Court Advantage:
http://fivethirtyeight.blogs.nytime...tell-different-tales-about-state-of-campaign/"Although this calculation might seem involved, the way to read the voting index is relatively straightforward. In Missouri, for example, the index is Republican plus 6.7 points. What this means is that if the popular vote were exactly tied nationally, we’d expect the Republican candidate to carry Missouri by 6.7 percentage points."
Historical Monthly Jobs Report correlations:
http://fivethirtyeight.blogs.nytimes.com/2012/05/04/has-obamas-magic-jobs-number-changed/
Caveats:
- Skewed seasonal adjustment factor?: http://ftalphaville.ft.com/blog/2012/07/06/1074731/seasonality-and-jobs-one-more-time/
- Unemployment rate by Education Attained: http://www.bls.gov/web/empsit/cpseea05.htm
- Unemployment rate by Race / Sex: http://www.bls.gov/cps/cpsaat07.htm
- Most true swing states, except Florida and Nevada I believe, have unemployment rates well below national average and IIRC Nevada's rate is falling fast, though it started from very high level
- Morningstar economist Bob Johnson says seasonally adjusted monthly jobs gains have been about 150K on average for first 6 months. He sees modest acceleration of economy in second half and monthly jobs gains accelerating in particular because of new home starts tailwind (construction workers getting hired. e. g. IIRC, Toll Brothers recently said they are seeing shortage of construction workers in some markets, and they see strength in all markets across country they serve. I forgot exact number, but I think he said around 175K per month was his guess) http://www.morningstar.com/cover/videocenter.aspx?id=563032
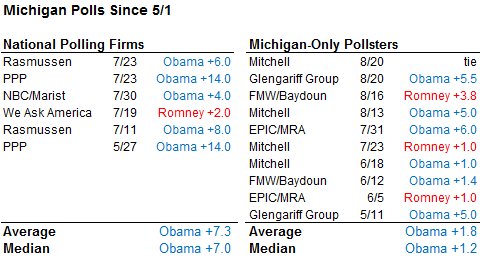
Disingenuous Outliers?:
"Perhaps 90 or 95 percent of the time, taking a simple average of the polls will work just about as well as the more complicated FiveThirtyEight method. But this is rare instance where taking all the polls at face value may be a mistake, and the additional checks-and-balances the FiveThirtyEight method applies are worth the trouble."
http://fivethirtyeight.blogs.nytimes.com/2012/08/28/aug-27-michigan-isnt-a-tossup/
Seven Ways to Read a Poll:
http://fivethirtyeight.blogs.nytimes.com/2012/08/24/aug-23-seven-ways-to-evaluate-a-poll/
"Any time that a candidate is leading in a state, and he simply maintains that lead, that counts as a modest positive for him because time is running off his opponent’s clock. A three-point deficit in April is very easy to overcome. In August? Still plenty of time, but there’s room for a touch of concern. On election eve? Oops — it’s probably too late.
There’s no need for Mr. Romney to panic yet, especially since he has gotten his share of decent state polls recently. But if Mr. Obama still holds a three-point lead in Ohio after the party conventions, it’s going to qualify as a negative for Mr. Romney every time that he fails to reduce the gap."
Last edited: