- May 6, 2020
- 12
- 2
- 41
I've been looking at a lot of review sites, and a common thread is that there is very little consistency amongst them. Either between Review sites, or quite often even from one Review to the next on the same site.
This varies from Revew site to site, and I'd say in general, the Anandtech site has pretty good quality reviews in terms of giving you useful information and analysis: however it is generally quite inconsistent with what other sites do. Or with what the NAND manufactuers, or industry groups recommend.
There are standards by industry groups such as SNIA, and the manufacturers have all issued white papers, and reports on how SSD Benchmarking should be done.
Why don't Reviewers follow these?
And I'm saying "Reviewers" in general, I'm not saying Anandtech is the only one not to do so.
And I'm sure it does follow SOME of them, but not in a consistent or complete manner.
And you need to do that for a benchmark to be meaningfull.
A non-exhaustive list of papers and reports from the SSD industry follows:
(1) SNIA:Introduction to SNIA Persistent Memory Performance Test Specification (2020)
(2) SNIA: Solid State Storage (SSS) Performance Test Specification (PTS) (Version 2.0.1)
(3) Smith: Solid State Storage (SSS) Performance Test Specification (PTS)
(4) EstherSpanjer_The_Why_How_SSD_Performance_Benchmarking
(5) Kim - Bring your SSD testing up to date
(6) Micron TNFD15 Micron PC320h-P420m SSD Performance Optimisation and Testing
(7) Seagate - Lies, Damn Lies And SSD Benchmark Test Result
I can provide URLS for these, but it's easy to have Mr. Google find them for you.
-----------------------------------------------------------------------
The Seagate report is excellent, and is extremely critical of Reviewers and benchmarks in general, I quote:
(1) "Despite the honorable intentions of independent labs and vendors alike, SSD benchmark test results are often meaningless or misleading because the list of what can be done wrong is long."
(2) "The potential problems begin with the benchmark tests themselves. Some are better than others, and none is perfect. Understanding and somehow mitigating their inherent limitations is, therefore, important to achieving meaningful test results."
(3) "Because all of these inherent limitations can be overcome by following a set of best test practices (covered in the next section), the
three leading causes of meaningless or misleading benchmark test results involve the operator. And these are:
#3 - Ignorance
#2 - Errors
#1 - Laziness"
(4) "It is vitally important to run each and every benchmark test until steady state results are achieved. Doing so is the only way to ensure that the SSDs have been properly preconditioned and are performing normally—as they would in a real application. This aspect of SSD benchmark testing presents the greatest temptation to declare “good enough!” and halt the test prematurely."
(5) "Although preconditioning has minimal impact on sequential data read/ write performance, entropy does have an impact and will, therefore, require the same three different levels of testing."
The only way to simplify this additional requirement is to use an average level of entropy for the target application(s), when known, or a mix of “typical” applications. Iometer is the best benchmark for testing known target applications because it enables the use of actual data. Iometer, PCMark Vantage and Anvil are all good choices for testing a mix of “typical” applications, and a reasonable “average” data entropy to use in this case is about 50%. Anvil supports a number of entropy levels, making it a good choice for performing a series of three tests at low, medium and high levels of entropy. CrystalDiskMark could be a good choice because it can test with both low and high entropy data, with the latter being the default configuration. AS-SSD and ATTO are poor choices because they utilize data with only high or only low entropy, respectively, and therefore they provide misleading results for SSDs with data reduction technology."
----------------------------------------------------------------------------
And there's nothing to stop a Reviewer from running a benchmark until steady state, but also quoting results before that occurs, as long as it's done in a meaningfull way.
For instance, if you run a sequential write test, to determine when the pSLC is exhausted, then it's better if you report the results as Data vs Time, as well as Transfer Speed (in MB/sec or IOPS). I shall post more examples of this separately, but see he attached as an example.
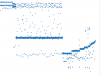
I don't really see the scatter plot that was done in the Anandtech Review as very useful. Yes you can see where the pSLC was exhausted, but after that, you cannot even tell what the overall average data transfer speed was. Too much jumping around.
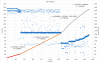
I used image analysis to plot each point, and transformed the MB/sec vs Data to a Time vs Data curve.
And then broke it into four parts:
(1) Before SLC cache full
(2) Quite steady period (as in constant slope)
(3) Non-linear region where transfer speed tends to speed up and the drive gets fuller
(4) Last 16GB (I included that just because Anandtech tends to do that)
And note that for all four regions, you can fit a VERY good linear regression: the R^2 is given in each case, better than 0.999.
And having a fitted function means you can easily get whatever information you want from the test, by specifying either Data or Time.
And the overall average data transfer rate is the slope of each region's fitted line.
My analysis gives exactly the same overall results as the Anandtech one does in terms of overall and average speeds, and gives MUCH more useful information as well.
I have been noting the times it takes to write a given amount of data to a drive:
Times for the following data to be written (GB): 12.5, 25, 50, 100, 200, 400, 800, 1600 (if 2TB)
This can be done for a wide range of SSD drive models, and you can then plot the results and quickly see trends.
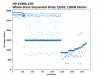
See the attached for some drives from Tom's Hardware, where they did poor job of giving the Review data.
---------------------------------------
Note: I say it's a poor job by Tom's Hardware because you cannot get anything quantitatively useful from it.
The problems are:
- X-scale is non-linear, it's not an XY plot, but a line plot
- The curves are all solid lines, without indication that they are actually only 6 data points per curve
- Being told time, and transfer speed is useless information (Trump News, er Fake News)
- What you WANT is how long it takes to transfer a given amount of data
And even worse, from a technical viewpoint, is that this botched-up graph hides the very useful relationships that jump out immediately when you see my re-proccessing of the same data.
---------------------------------------
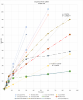
So I redid it, and got some useful results.
If you look at my graph (all for 1TB SSD's), you can see there are two types of behaviour: one behaves in a linear fashion, and the other type (with dashed lines) tend to slow down as time goes on.
And you can see that for all of the first type, they maintain their relative ranking all throughout the data writing.
As a Reviewer, and paid up member of the CCRA (see later...:-} I'd then be telling you WHY there are two groups.
And THEN, one could use that information to look at a new SSD, and predict how it would perform.
In addition, you can see the Adata XPG XS6000 Pro starts off very well, but quite soon it starts fading, and ends up to be tied for 2nd worst place.
If you want to trransfer a lot of data, quite often, it's obviously a poor choice.
In terms of performance, and cost, over the whole range, the Adata XPG SX8200 Pro does the best. It's one the fastest at low volumes, and even at the end, it's really only surpassed by the much pricier Samsung 970 EVO/Pro drives, and Intel Optane drive.
And the point is that if its time based you have a lot of advantages:
- You can see if there are thermal effects by adding in the temperature sensor readings
- It's obvious when steady state is reached
- You can mark off useful points, where a given amount of data has been written (like 10 GB, 50 GB etc etc.) and then compare performance to other drives
- The "noisiness" of plotting MB/sec on its own is reduced (as you will see from my other post)
It's still useful to plot MB/sec or IOPS, but more to help you understand what's going on with a given data vs time plot in terms of a mechanism.
----------------------------------------------------------------------------
It's pretty clear that there are some very commonly used benchmarking tools, that have been used by a lot of Reviewers, and are used by the Manufacturers, and there is a pretty good archive of results.
As you can read, SanDisk is not fond of AS-SSD and ATTO, however they have been run by a lot of reviewers, and having the results can still be of some help if you are careful in using them.
I think it would be good if all Reviewers ran these benchmarks, and posted the results, and then after that they could do whatever else they felt was needed. In effect, these are the defacto SSD benchmarks:
- ASSD
- Crystal DiskMark
- Atto
- Anvil
- HD-Tach
- PCMark Vantage
- IOmeter
These are not difficult, or time consuming to run. And if a Reviewer ran them, then at least your readers could do a better job of comparing SSD's that they had experience with, rather then from a limitted list of what a given reviewer had at hand.
-----------------------------------------------------------------------------
In addition, it would be very helpful if there was an user-friendly archive of benchmark results, that was in a standard format, and had all the useful infomation on it, and even a link to the review. With things like a photo of the device, etc. A very good example of an excellent archive is the one on TechPowerUp for GPU's. That's very well laid out.
Why not do the same for SSD's?
I know Anandtecxh has an archive, but it's nowhere near as useful as the one the TPU has for GPU's.
---------------------------------------------------------------------------
I know that a lot of computing component Reviewers say "our readers are all gamers, who are only interested in flashing LED's (and warrior girls with big XXXX waving bigger swords)", but I think that's incorrect, as well as a somewhat self-fulfilling viewpoint. In that there are indeed many others who don't have a fetish for flashing LED's (although they might like warrior girls and boyz), and who DO visit the review sites. And you could attract MORE if you had more rigorous reviews that looked at components to be used other than to play video games (which is fine, but you can use a compouter for other things too).
One sector is the works-station crowd.
Or those using laptops for heavy duty image processing etc.
Or university students who like LED's as well as need to run MATLAB.
There is an interesting group called the Standard Performance Evaluation Corporation (SPEC) who has some good benchmarks for computer components, where you need a bit more than flashing LED's. They are non-profit, and in fact are made up of all of your advertisers.
I'm not sure how you are viewed by SPEC, because you are for-profit.
And that means to join, you need to pay.
And you might be able to motivate for access to the benchmarks by emphasizing your journalistic role: which in many ways you do fulfill. And perhaps you could motivate for access to the benchmarks by saying your access will make them more popular. In any case, you can buy a licence for $2k-$5k for a given package, which is quite cheap for software.
At the end of the day, Reviewers make money to pay the bills by attracting readers to the site, and hopefully having them use the links to buy stuff. Any idiot can run a few software programs on an SSD they've been given for free by a manufacturer. In fact you don't even need to DO the tests, you could steal the data from someone else, and I guess some do. But what brings people to a site like Anandtech, and TechPowerUp, is the intelligent discussion of the results.
However, if you look at the SPEC structure, you see four groups:
(1) Component- and system-level benchmarks in an UNIX / NT / VMS environment
(2) Benchmarking in a numeric computing environment, with emphasis on high-performance numeric computing
(3) Benchmarks for measuring the performance of professional-level workstations and graphics subsystems
(4) Research group
Hmmm....no flashing LEDs' with Big XXX Babes and Boys with big swords.........
is that a problem?
Well, you CAN join group (2) and (3).
Like those guys are nerds, and I bet a LOT of them like flashing LED's and Big......
So that's a start.
But why not start off in Group (3) and (4), and then make a Group (5)?
The Flashing LED Group?
With Big.....
They'll help you draft a benchmark to run: lots of nerds who like Big.....
-----------------------------------------------------------------------------
My Recommendations:
(1) Anandtech should set an example by either running benchmarks according to these points, or explain why they aren't, and what they think should be done to improve them
(2) Give more information on the Benchmarks that they run, so it is possible to see if they do indeed satisfy the required points
(3) Speak to SNIA, and perhaps ask to join, even in an Observer mode
(4) Talk to the other Reviewers, and give your support for being more consistent
(5) Talk to the Manufacturers, and ask for their feedback, and ask that they support the efforts of Reviewers who benchmark properly
I'd even ask them to send someone to audit your test procedures.
(6) Talk to SPEc.
Join Groups 3 and 4, and look into creating group 5
Aside: I think you could form an industry group, say called the Computer Components Review Association (CCRA), and draft your own standard of how to benchmark things.
Ideally in agreement with the Manufacturers!!
In addition, I see no reason why you couldn't suggest that manufacturers send a sample of each new drive, and that it's tested according to the CCRA Standard. You could charge for your time.
Everyone gains.
And it stops the dodgy review sites from stealing data because they aren't in the CCRA, or at least they weren't asked to do the review.
And anyone is allowed to use the end results of a Review, it's public domain, paid for by the Manufacturers.
But as I said before, the real reason people come to your site is because you have smart people, and make smart comments.
You've got nothing to lose from this.
This varies from Revew site to site, and I'd say in general, the Anandtech site has pretty good quality reviews in terms of giving you useful information and analysis: however it is generally quite inconsistent with what other sites do. Or with what the NAND manufactuers, or industry groups recommend.
There are standards by industry groups such as SNIA, and the manufacturers have all issued white papers, and reports on how SSD Benchmarking should be done.
Why don't Reviewers follow these?
And I'm saying "Reviewers" in general, I'm not saying Anandtech is the only one not to do so.
And I'm sure it does follow SOME of them, but not in a consistent or complete manner.
And you need to do that for a benchmark to be meaningfull.
A non-exhaustive list of papers and reports from the SSD industry follows:
(1) SNIA:Introduction to SNIA Persistent Memory Performance Test Specification (2020)
(2) SNIA: Solid State Storage (SSS) Performance Test Specification (PTS) (Version 2.0.1)
(3) Smith: Solid State Storage (SSS) Performance Test Specification (PTS)
(4) EstherSpanjer_The_Why_How_SSD_Performance_Benchmarking
(5) Kim - Bring your SSD testing up to date
(6) Micron TNFD15 Micron PC320h-P420m SSD Performance Optimisation and Testing
(7) Seagate - Lies, Damn Lies And SSD Benchmark Test Result
I can provide URLS for these, but it's easy to have Mr. Google find them for you.
-----------------------------------------------------------------------
The Seagate report is excellent, and is extremely critical of Reviewers and benchmarks in general, I quote:
(1) "Despite the honorable intentions of independent labs and vendors alike, SSD benchmark test results are often meaningless or misleading because the list of what can be done wrong is long."
(2) "The potential problems begin with the benchmark tests themselves. Some are better than others, and none is perfect. Understanding and somehow mitigating their inherent limitations is, therefore, important to achieving meaningful test results."
(3) "Because all of these inherent limitations can be overcome by following a set of best test practices (covered in the next section), the
three leading causes of meaningless or misleading benchmark test results involve the operator. And these are:
#3 - Ignorance
#2 - Errors
#1 - Laziness"
(4) "It is vitally important to run each and every benchmark test until steady state results are achieved. Doing so is the only way to ensure that the SSDs have been properly preconditioned and are performing normally—as they would in a real application. This aspect of SSD benchmark testing presents the greatest temptation to declare “good enough!” and halt the test prematurely."
(5) "Although preconditioning has minimal impact on sequential data read/ write performance, entropy does have an impact and will, therefore, require the same three different levels of testing."
The only way to simplify this additional requirement is to use an average level of entropy for the target application(s), when known, or a mix of “typical” applications. Iometer is the best benchmark for testing known target applications because it enables the use of actual data. Iometer, PCMark Vantage and Anvil are all good choices for testing a mix of “typical” applications, and a reasonable “average” data entropy to use in this case is about 50%. Anvil supports a number of entropy levels, making it a good choice for performing a series of three tests at low, medium and high levels of entropy. CrystalDiskMark could be a good choice because it can test with both low and high entropy data, with the latter being the default configuration. AS-SSD and ATTO are poor choices because they utilize data with only high or only low entropy, respectively, and therefore they provide misleading results for SSDs with data reduction technology."
----------------------------------------------------------------------------
And there's nothing to stop a Reviewer from running a benchmark until steady state, but also quoting results before that occurs, as long as it's done in a meaningfull way.
For instance, if you run a sequential write test, to determine when the pSLC is exhausted, then it's better if you report the results as Data vs Time, as well as Transfer Speed (in MB/sec or IOPS). I shall post more examples of this separately, but see he attached as an example.
I don't really see the scatter plot that was done in the Anandtech Review as very useful. Yes you can see where the pSLC was exhausted, but after that, you cannot even tell what the overall average data transfer speed was. Too much jumping around.
I used image analysis to plot each point, and transformed the MB/sec vs Data to a Time vs Data curve.
And then broke it into four parts:
(1) Before SLC cache full
(2) Quite steady period (as in constant slope)
(3) Non-linear region where transfer speed tends to speed up and the drive gets fuller
(4) Last 16GB (I included that just because Anandtech tends to do that)
And note that for all four regions, you can fit a VERY good linear regression: the R^2 is given in each case, better than 0.999.
And having a fitted function means you can easily get whatever information you want from the test, by specifying either Data or Time.
And the overall average data transfer rate is the slope of each region's fitted line.
My analysis gives exactly the same overall results as the Anandtech one does in terms of overall and average speeds, and gives MUCH more useful information as well.
I have been noting the times it takes to write a given amount of data to a drive:
Times for the following data to be written (GB): 12.5, 25, 50, 100, 200, 400, 800, 1600 (if 2TB)
This can be done for a wide range of SSD drive models, and you can then plot the results and quickly see trends.
See the attached for some drives from Tom's Hardware, where they did poor job of giving the Review data.
---------------------------------------
Note: I say it's a poor job by Tom's Hardware because you cannot get anything quantitatively useful from it.
The problems are:
- X-scale is non-linear, it's not an XY plot, but a line plot
- The curves are all solid lines, without indication that they are actually only 6 data points per curve
- Being told time, and transfer speed is useless information (Trump News, er Fake News)
- What you WANT is how long it takes to transfer a given amount of data
And even worse, from a technical viewpoint, is that this botched-up graph hides the very useful relationships that jump out immediately when you see my re-proccessing of the same data.
---------------------------------------
So I redid it, and got some useful results.
If you look at my graph (all for 1TB SSD's), you can see there are two types of behaviour: one behaves in a linear fashion, and the other type (with dashed lines) tend to slow down as time goes on.
And you can see that for all of the first type, they maintain their relative ranking all throughout the data writing.
As a Reviewer, and paid up member of the CCRA (see later...:-} I'd then be telling you WHY there are two groups.
And THEN, one could use that information to look at a new SSD, and predict how it would perform.
In addition, you can see the Adata XPG XS6000 Pro starts off very well, but quite soon it starts fading, and ends up to be tied for 2nd worst place.
If you want to trransfer a lot of data, quite often, it's obviously a poor choice.
In terms of performance, and cost, over the whole range, the Adata XPG SX8200 Pro does the best. It's one the fastest at low volumes, and even at the end, it's really only surpassed by the much pricier Samsung 970 EVO/Pro drives, and Intel Optane drive.
And the point is that if its time based you have a lot of advantages:
- You can see if there are thermal effects by adding in the temperature sensor readings
- It's obvious when steady state is reached
- You can mark off useful points, where a given amount of data has been written (like 10 GB, 50 GB etc etc.) and then compare performance to other drives
- The "noisiness" of plotting MB/sec on its own is reduced (as you will see from my other post)
It's still useful to plot MB/sec or IOPS, but more to help you understand what's going on with a given data vs time plot in terms of a mechanism.
----------------------------------------------------------------------------
It's pretty clear that there are some very commonly used benchmarking tools, that have been used by a lot of Reviewers, and are used by the Manufacturers, and there is a pretty good archive of results.
As you can read, SanDisk is not fond of AS-SSD and ATTO, however they have been run by a lot of reviewers, and having the results can still be of some help if you are careful in using them.
I think it would be good if all Reviewers ran these benchmarks, and posted the results, and then after that they could do whatever else they felt was needed. In effect, these are the defacto SSD benchmarks:
- ASSD
- Crystal DiskMark
- Atto
- Anvil
- HD-Tach
- PCMark Vantage
- IOmeter
These are not difficult, or time consuming to run. And if a Reviewer ran them, then at least your readers could do a better job of comparing SSD's that they had experience with, rather then from a limitted list of what a given reviewer had at hand.
-----------------------------------------------------------------------------
In addition, it would be very helpful if there was an user-friendly archive of benchmark results, that was in a standard format, and had all the useful infomation on it, and even a link to the review. With things like a photo of the device, etc. A very good example of an excellent archive is the one on TechPowerUp for GPU's. That's very well laid out.
Why not do the same for SSD's?
I know Anandtecxh has an archive, but it's nowhere near as useful as the one the TPU has for GPU's.
---------------------------------------------------------------------------
I know that a lot of computing component Reviewers say "our readers are all gamers, who are only interested in flashing LED's (and warrior girls with big XXXX waving bigger swords)", but I think that's incorrect, as well as a somewhat self-fulfilling viewpoint. In that there are indeed many others who don't have a fetish for flashing LED's (although they might like warrior girls and boyz), and who DO visit the review sites. And you could attract MORE if you had more rigorous reviews that looked at components to be used other than to play video games (which is fine, but you can use a compouter for other things too).
One sector is the works-station crowd.
Or those using laptops for heavy duty image processing etc.
Or university students who like LED's as well as need to run MATLAB.
There is an interesting group called the Standard Performance Evaluation Corporation (SPEC) who has some good benchmarks for computer components, where you need a bit more than flashing LED's. They are non-profit, and in fact are made up of all of your advertisers.
I'm not sure how you are viewed by SPEC, because you are for-profit.
And that means to join, you need to pay.
And you might be able to motivate for access to the benchmarks by emphasizing your journalistic role: which in many ways you do fulfill. And perhaps you could motivate for access to the benchmarks by saying your access will make them more popular. In any case, you can buy a licence for $2k-$5k for a given package, which is quite cheap for software.
At the end of the day, Reviewers make money to pay the bills by attracting readers to the site, and hopefully having them use the links to buy stuff. Any idiot can run a few software programs on an SSD they've been given for free by a manufacturer. In fact you don't even need to DO the tests, you could steal the data from someone else, and I guess some do. But what brings people to a site like Anandtech, and TechPowerUp, is the intelligent discussion of the results.
However, if you look at the SPEC structure, you see four groups:
(1) Component- and system-level benchmarks in an UNIX / NT / VMS environment
(2) Benchmarking in a numeric computing environment, with emphasis on high-performance numeric computing
(3) Benchmarks for measuring the performance of professional-level workstations and graphics subsystems
(4) Research group
Hmmm....no flashing LEDs' with Big XXX Babes and Boys with big swords.........
is that a problem?
Well, you CAN join group (2) and (3).
Like those guys are nerds, and I bet a LOT of them like flashing LED's and Big......
So that's a start.
But why not start off in Group (3) and (4), and then make a Group (5)?
The Flashing LED Group?
With Big.....
They'll help you draft a benchmark to run: lots of nerds who like Big.....
-----------------------------------------------------------------------------
My Recommendations:
(1) Anandtech should set an example by either running benchmarks according to these points, or explain why they aren't, and what they think should be done to improve them
(2) Give more information on the Benchmarks that they run, so it is possible to see if they do indeed satisfy the required points
(3) Speak to SNIA, and perhaps ask to join, even in an Observer mode
(4) Talk to the other Reviewers, and give your support for being more consistent
(5) Talk to the Manufacturers, and ask for their feedback, and ask that they support the efforts of Reviewers who benchmark properly
I'd even ask them to send someone to audit your test procedures.
(6) Talk to SPEc.
Join Groups 3 and 4, and look into creating group 5
Aside: I think you could form an industry group, say called the Computer Components Review Association (CCRA), and draft your own standard of how to benchmark things.
Ideally in agreement with the Manufacturers!!
In addition, I see no reason why you couldn't suggest that manufacturers send a sample of each new drive, and that it's tested according to the CCRA Standard. You could charge for your time.
Everyone gains.
And it stops the dodgy review sites from stealing data because they aren't in the CCRA, or at least they weren't asked to do the review.
And anyone is allowed to use the end results of a Review, it's public domain, paid for by the Manufacturers.
But as I said before, the real reason people come to your site is because you have smart people, and make smart comments.
You've got nothing to lose from this.