That disclaimer... How are we supposed to trust these numbers? I mean, we have that Geekbench leak showing ~+15% increase, but still.
Is there another slide around that has the setup and benchmark details?
I did a bit of a write up on this earlier today. I am reposting it with mild editing (not shown):
Around Kaby to Coffee, due to changes in the cache sizes, there was an appreciable (more than variance) increase in IPC, even if limited. Cache changes will effect IPC, are hard to separate from IPC, and should be noted.
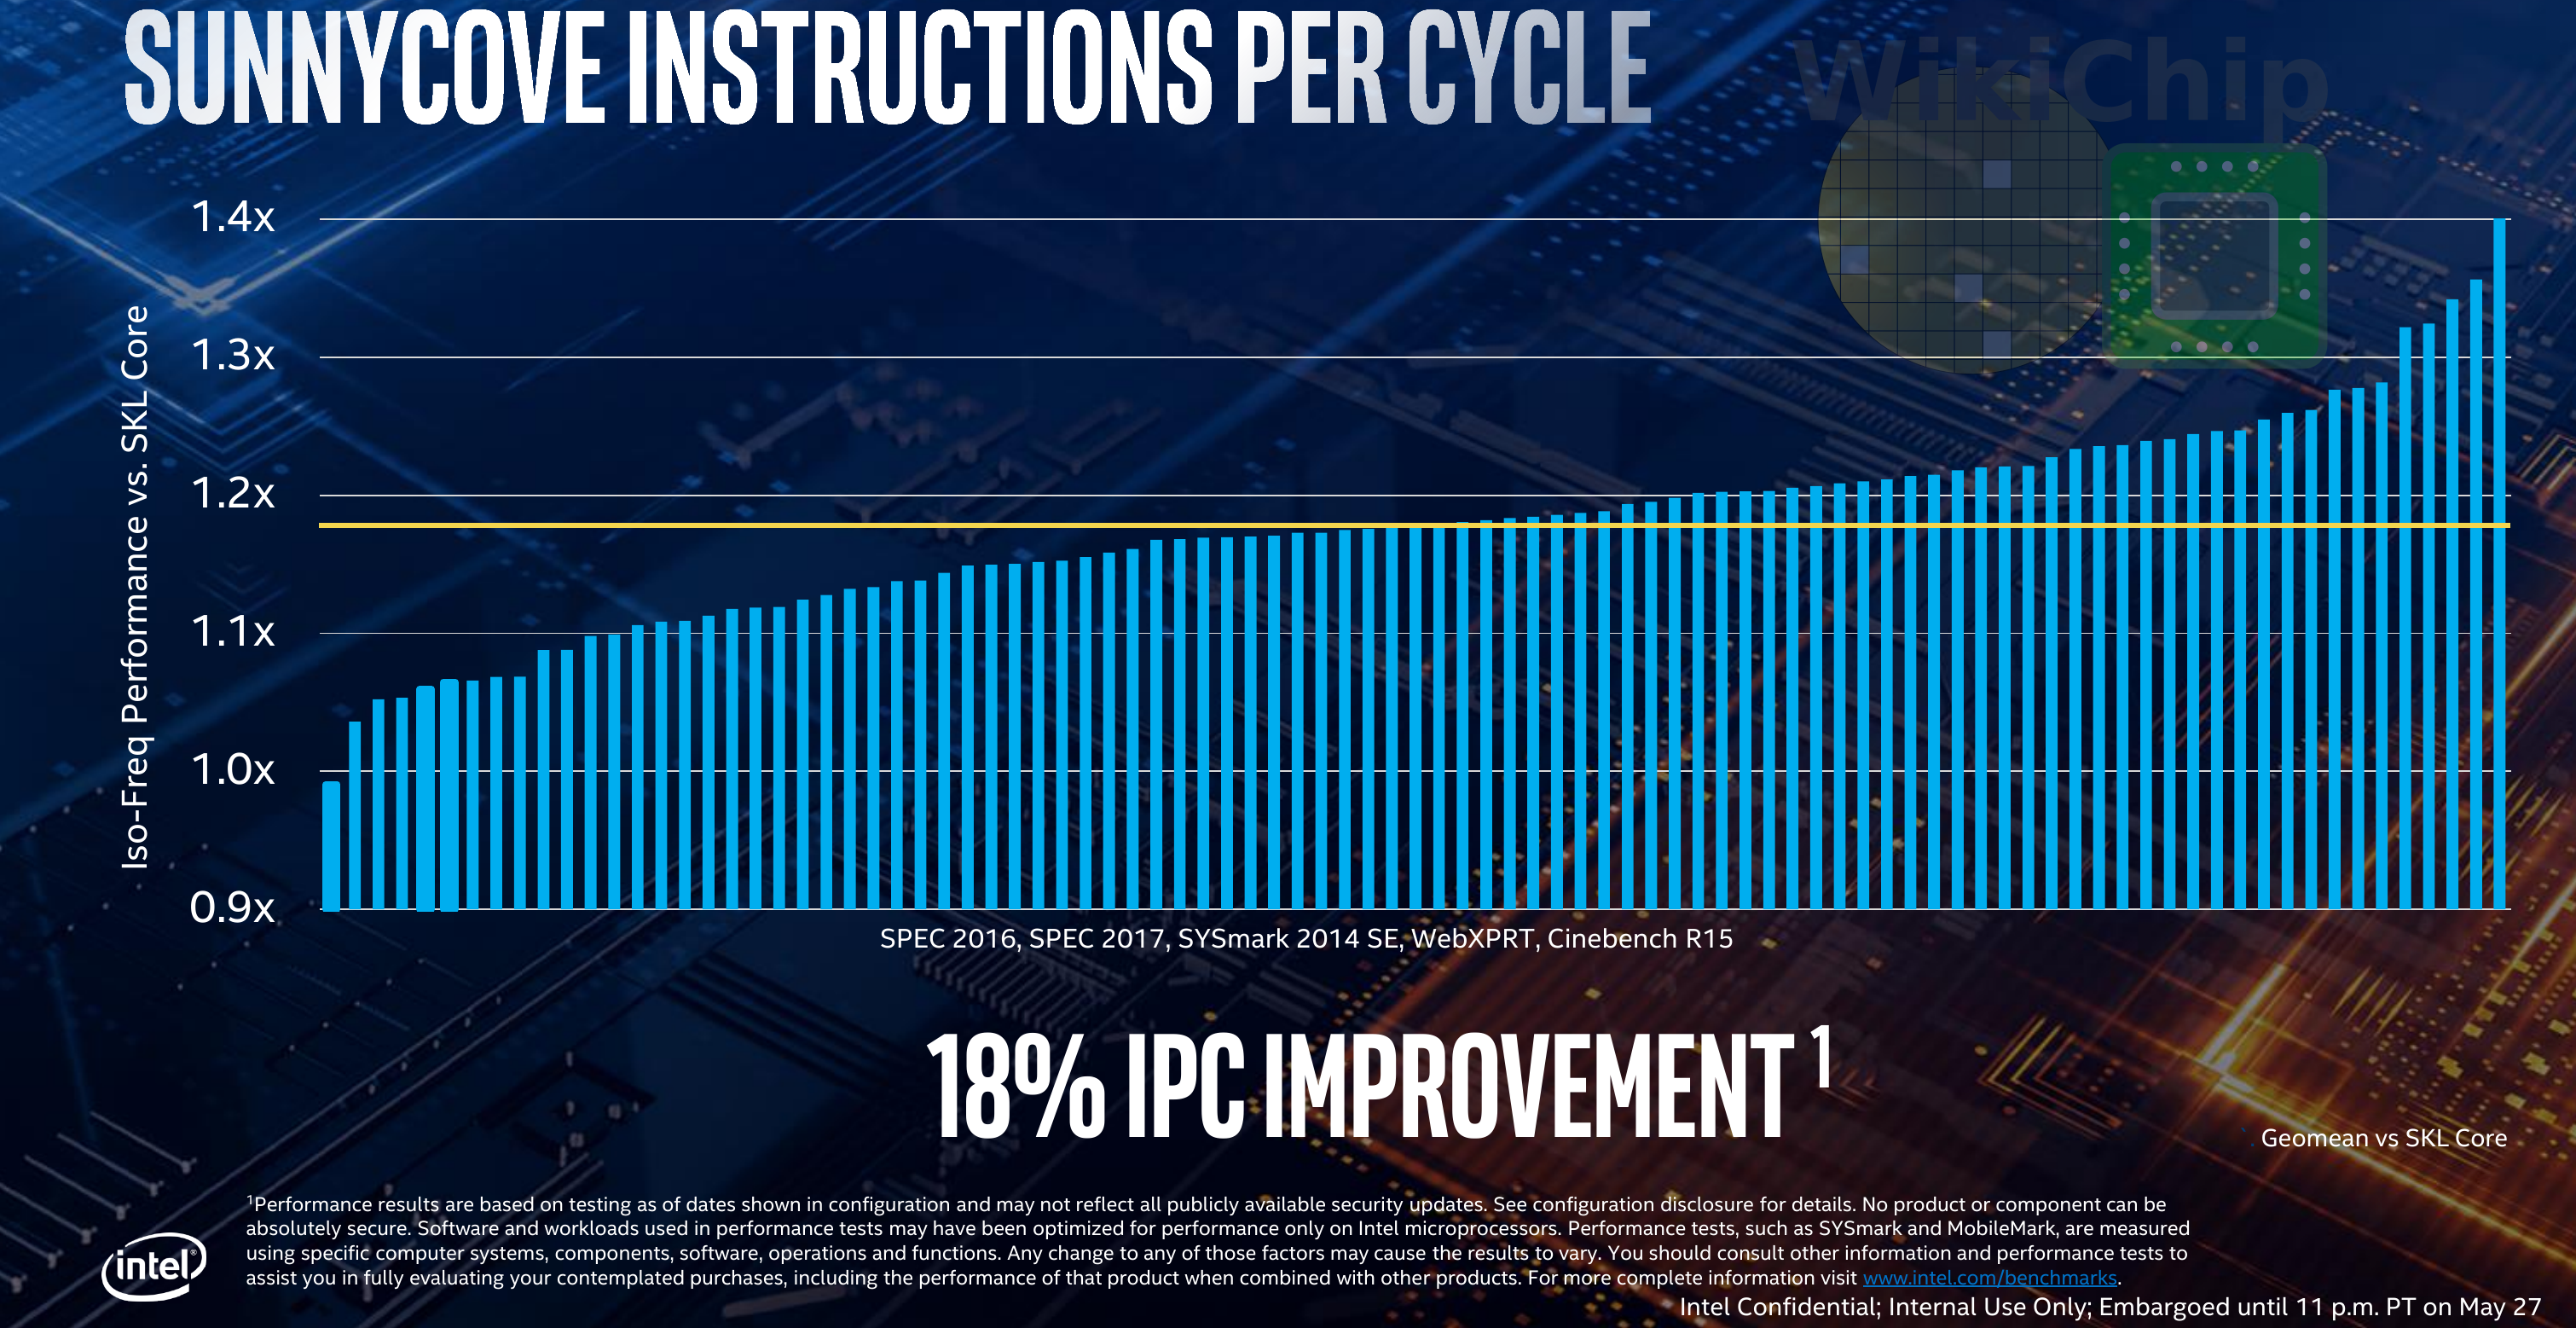
Moreover, I noticed that the Intel graph DOES NOT HAVE an X-axis label on their infographic. THAT is a problem. Take a look for yourself:


So, SPEC 2016 & 2017 were used, Sysmark 2014 SE, WEBXPRT, and CB15 were used in the IPC slide (which doesn't separate them out nor have any label for the X-axis to understand what the increase is relative to in the slide). For the Core Performance slide, they used SPECInt 2006. All of these were internally compiled, which Intel has been caught before using flags in compilers that would NOT be allowed in a commercially released product (not saying that occurred here, just saying it has occurred before).
Have you seen what sort of scores can be reached on first gen Ryzen 1950X when using Linux and the -O3 flag? Night and day versus regular compiling without platform optimizations. Intel specifically claims that they were compiled for the specific platform and that using it on any other platform could materially change the results. That sounds like hyper-optimization.
But, aside from those things, look at the benchmarks used. Are any of those your "go to" on benchmarks to estimate performance? CB15 gets the closest, yet then you run into the same criticism that is hoisted upon AMD.
Let's dive into the impact on mitigations. Start with Sysmark 2014 SE by BAPco.
https://www.anandtech.com/show/1365...ith-spectre-and-meltdown-hardware-mitigations
As you can see, there is a 6% drop in performance from before being patched to after. Now the article shows lower numbers with the overall categories, and it doesn't give us the full breakdown by test, but it should be remembered that the impact is seen more on elevated requests for I/O processing, which is not going to impact consumer programs as much, and which the bulk of Anandtech's testing takes place on, versus what is seen in professional workloads, which those benches more closely address. But the point is that, if the tests used have an average similar to that 6% drop due to mitigations, then they really only have a 12% IPC change, which is a very different claim (although even that may put AMD and Intel's IPC on parity again, meaning the fastest CPU wins, which currently is Intel).
When you look at the SPEC 2016 and 2017, then a custom SPECInt 2006, and it seems like some gaming is afoot. From the footnotes, Intel specifically claims it may or may not have included all software mitigations at the time of testing. That means, specifically, some of the mitigations ARE in place. Now, there is a question on when the tests were conducted. The public release of patches for Zombieload, etc., didn't arrive until May 11th. That means those may or may not be included. We don't know what all microcode was applied to the platform, what was turned on in OS mitigations, etc. Hell, we don't even know for certain whether it is comparing HT on and off, although I will assume for Intel's sake it was on. We don't know if the Portsmash fix was incorporated either.
So, depending on the state of the vulnerability mitigations, much of that IPC increase truly could be mitigations and clawing back lost performance. We simply do not know.
What we can say for sure is the 40% raw performance number comes from comparing a skylake-u sample to an icelake-U sample, which comes with more advanced boosting and higher clock speeds which is mixed with the IPC gains and with the software mitigation sandbags. Plus, that was ONLY showed with SPECInt 2006, which is curious why they wouldn't do a multi-benchmark analysis for overall performance, instead relying on an old integer benchmark with new CPU optimizations in compiling.
As for the claims on the laptop iGPU, those are NOT accurate. They used 3733, then they stuck AMD's APU with DDR4 2400, which means they are using 55% less bandwidth for the comparison.
They also OVERCLOCKED the Ice Lake-U CPU to 25W, meaning the performance shown is not what you get, then tried to justify the 2400MHz as what you will commercially buy on the AMD machine, meaning that they are using dual standards for the testing of the device (not surprising with Ryan Shrout). If you wanted to make the fight about the performance of the actual tested component, you have to standardize the other variables. Without that, you are not properly comparing ANYTHING.
But, with that said, let's dive into changes they made to the uArch that could actually achieve a sizeable IPC uplift, which would make the claim real.

 https://wccftech.com/intel-10nm-ice-lake-18-pc-ipc/
Intel has increased the L1 data cache by 50%, they doubled the L2 cache to 512KB, increased microop cache, the Out of Order Execution window has been expanded, etc. Now, for the cache, this can lower cache and memory latencies further, which can boost IPC. The OoO window can allow for the data to not be retired as quickly with the speculative execution mitigations in place, which would save on the stale data problem, helping to bring that back up in performance.
They also increased the width of allocation, expanded the execution ports by 25%, doubled the L1 store bandwidth, added an extra AGU (33% more), and doubled the store data. If you look, much of this can help with the mitigations applied for security vulnerabilities when combined with above features.
But, putting security aside for a moment, all of the above can improve the IPC performance of a chip on certain workloads. It isn't a question of if they improved the IPC, rather it is a question of by how much they increased it.
Intel never sat still while not using the uArch Sunny Cove. They have been refining it. So I'm waiting for better third party reviews to find out the actual amount.