
Delidded my i7-3770K, loaded temperatures drop by 20°C at 4.7GHz
Page 25 - Seeking answers? Join the AnandTech community: where nearly half-a-million members share solutions and discuss the latest tech.
You are using an out of date browser. It may not display this or other websites correctly.
You should upgrade or use an alternative browser.
You should upgrade or use an alternative browser.
BonzaiDuck
Lifer
- Jun 30, 2004
- 15,725
- 1,455
- 126
Well said.
And . . . frankly . . . old "motor-mouth" [the Duck] here might like to "add" some remarks, but also frankly -- IDontCare already offers enough of them.
And so -- yes -- "Well said."
Klunt Bumskrint
Member
- Aug 30, 2012
- 73
- 0
- 0
Answer will obviously depend on why the chip was purchased in the first place - and that will be different person-to-person.
I already owned a 2600k when I bought the 3770k. I bought the 3770k 100% purely for hobby/entertainment purposes and planned to pretty much just mess around with it and either kill it in the process or eventually repurpose it to replace an existing Q6600 box that I use to harvest market data at this time.
So for me the answer would be yes, the entertainment value I have derived from delidding my 3770k has been thoroughly worth the risk of killing the chip in the process. It has been far and away more enjoyable than the fun I had with my 2600k which at most all I could do was lap the IHS.
But if I were purely looking at this from the perspective of "did it improve the performance of the 3770k enough to justify the risk of possible destroying a $300 investment just to get an extra 100MHz or 200MHz?" then I would have to say the answer is absolutely not, the paltry performance gains of adding on another 100-200 MHz is probably not worth the risk of permanently damaging a $300 CPU.
If I were in that much need for the performance, a situation where 4.4GHz was not acceptable and I really had to have 4.7GHz then I would just go buy a 2600k or 2700k, lap it, and push the volts through it and hit 5GHz.
If I were building an IvyBridge based system for anyone else I would not delid it. I would leave it "as is". If cooling was a concern because the person didn't want to listen to a noisy HSF then I'd spend money on quieter fans versus adding in the risk of destroying a $300 chip.
But if you are looking at wanting a cooler CPU and you enjoy tinkering under the hood then delidding is a rewarding process to put yourself through from a hobby perspective.
Just my opinion, I suspect everyone has a different take on it.
I think I'll give it a miss, I have big hands and no patience. I'd slip and fcuk it up!
Delidding and mounting bare die lowered my temps enough that I can safely run 4.6ghz where my temps were high enough before that 4.5 was as high as I wanted to go. I'm already well into the realm of diminishing returns though.
I wouldn't recommend it to anyone who isn't trying to push clocks like you could on Sandy Bridge. With Sandy, and if you had a good chip, you could keep adding volts and scale the clocks up to the stratosphere. I believe there's a guy on this forum who has a SB that he's taken to 5.6ghz without extreme cooling, and you simply can't do that on Ivy Bridge, lid or not, because you'll hit tjmax.
while I agree that there seems to be more of a sweet spot for ivy bridge (clock OC + very little voltage adding) . Tjmax for ivy bridge is 105c vs 85c for sandy bridge ?
not that the added overhead would help in OC as 80+ is still pretty high and temps is your enemy . Intel just raised the throttling point of IB .
Sandy Bridge TJmax is 98°C, Ivy Bridge is 105°C.
It is true that if you do not delid the IB then your OC efforts will be TJmax-limited and not voltage limited, unlike Sandy Bridge.
But if you do delid your IB you will be able to get into the clockspeed regime where your OC is voltage-limited instead of TJmax limited. (before delidding the max I could do was 4.7GHz with 1.3V using an H100 and my temps would peak at right under TJmax in LinX)
After delidding I can hit 5GHz with my 3770k without hitting 105°C, but it requires an insane voltage of ~1.45V and that is just asking for a quick death.
So I keep the max clocks at 4.8GHz (1.36V) with temps around 80°C.
Ok, thanks for input , I see what you mean .Sandy Bridge TJmax is 98°C, Ivy Bridge is 105°C.
It is true that if you do not delid the IB then your OC efforts will be TJmax-limited and not voltage limited, unlike Sandy Bridge.
But if you do delid your IB you will be able to get into the clockspeed regime where your OC is voltage-limited instead of TJmax limited. (before delidding the max I could do was 4.7GHz with 1.3V using an H100 and my temps would peak at right under TJmax in LinX)
After delidding I can hit 5GHz with my 3770k without hitting 105°C, but it requires an insane voltage of ~1.45V and that is just asking for a quick death.
So I keep the max clocks at 4.8GHz (1.36V) with temps around 80°C.
I think for most that want good thermals with decent OC that 4.2-4.5 in your graph were low voltage and small increase in temps is sweet spot .
For me 4.2 mark is sweet spot to get to as temps don't go to much higher than stock ,not like once you get to 4.5+ (I rather try an keep temps in 65-70 area ).
Last edited:
So I keep the max clocks at 4.8GHz (1.36V) with temps around 80°C.
Just a matter of curiosity. When people are referring to safe voltages, is this before vdroop or after?
I'm curious how much more I could put my processor through while still being in a "safe" range.
Yuriman
Diamond Member
- Jun 25, 2004
- 5,530
- 141
- 106
I leave LLC off with my overclocks but I try to stay under 1.30v fully loaded. I figure since it's a combination of temperature and voltage that kills a chip, 1.3v @ 80c and 1.35v and 50c are probably about equally bad.
If you use LLC you can probably mostly cancel out vdroop.
If you use LLC you can probably mostly cancel out vdroop.
Just a matter of curiosity. When people are referring to safe voltages, is this before vdroop or after?
I'm curious how much more I could put my processor through while still being in a "safe" range.
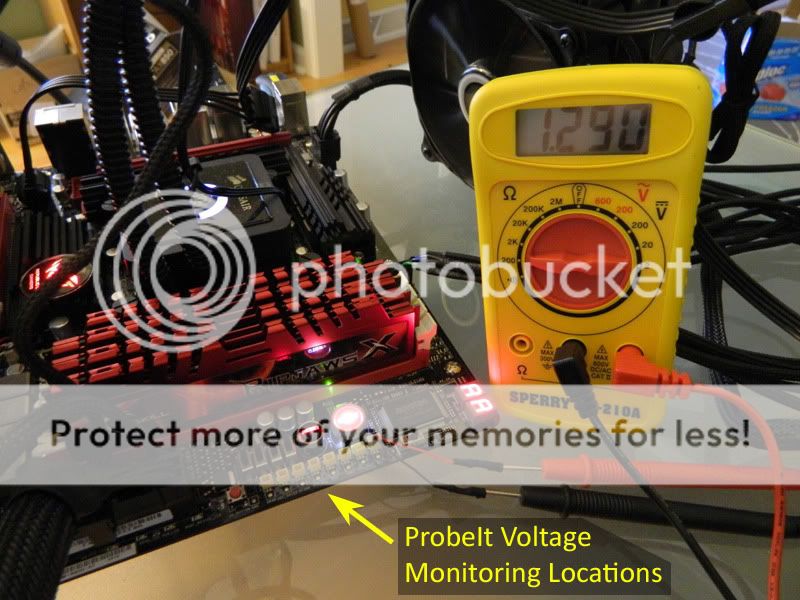
I realize my LLC results aren't what people would consider to be typical and I believe it is because of the specific mobo I am using (ASUS MIVE-Z, a $360 spendy sucker).
So for me all my results are with LLC and the Vdroop is pretty much zero, verified by a voltmeter and not software readings.
For example I am running a test right now with the Vcc set to 1.360V, the voltmeter is reading 1.361V actual voltage.
So you have it disabled in bios ?I leave LLC off with my overclocks but I try to stay under 1.30v fully loaded. I figure since it's a combination of temperature and voltage that kills a chip, 1.3v @ 80c and 1.35v and 50c are probably about equally bad.
If you use LLC you can probably mostly cancel out vdroop.
My Asus P8Z77v-pro has auto, regular, medium, high , ultra high and extreme . I thought leaving it on auto or regular gives you intel voltage table .
Yuriman
Diamond Member
- Jun 25, 2004
- 5,530
- 141
- 106
So you have it disabled in bios ?
My Asus P8Z77v-pro has auto, regular, medium, high , ultra high and extreme . I thought leaving it on auto or regular gives you intel voltage table .
That's what I assume too. My board has them listed as Level 1, 2, 3, 4 and 5, 5 being the least, which I guess is LLC off.
Hey guys,
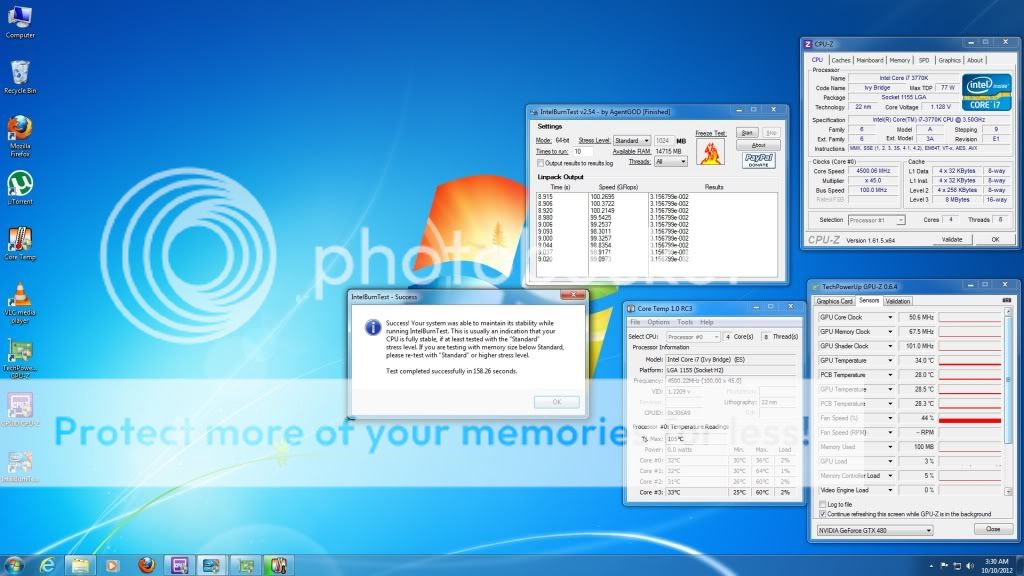
Sorry I haven't reported back in a bit, but I was finally able to get my loop rebuilt, and a fresh install of Win7 Pro..I just started overclocking this guy, and I must admit I am blown away by the low temperatures offered by the direct die mounting and the wonderful IC Diamond TIM..Here are some early results..Please keep in mind that I normally do not consider an o/c truly stable until I have run at least 25+ passes of IBT set on custom with maxium ram being used..This was just a quick baseline test to see if the cpu like this Vcore..Once I push on past 4.7Ghz and get stable, I will work on reducing my voltages etc..
Here is a quick shot of a run I just did with my fans set @ 7V..Please excuse the fact it is hard to see, I don't know what Photobucket is doing..The picture was 1080P, but they re-sized it way smaller and I can't seem to fix it

The temps are 59, 64, 63, and 62C with an ambient of 23C..I have all the voltages on "Auto" settings aside from a fixed Vcore of 1.128V..
I haven't tried anything lower, this was the stock setting that the MB was feeding the chip when Vcore was set to "Auto"...
In this second shot, I raised the voltage on my Gentle Typhoon AP-15s to their normal 12V..Temps dropped 3-4 degrees, they are 56, 64, 60 and 60C
What do you guys think of these temps? I am blown away!!
Sorry I haven't reported back in a bit, but I was finally able to get my loop rebuilt, and a fresh install of Win7 Pro..I just started overclocking this guy, and I must admit I am blown away by the low temperatures offered by the direct die mounting and the wonderful IC Diamond TIM..Here are some early results..Please keep in mind that I normally do not consider an o/c truly stable until I have run at least 25+ passes of IBT set on custom with maxium ram being used..This was just a quick baseline test to see if the cpu like this Vcore..Once I push on past 4.7Ghz and get stable, I will work on reducing my voltages etc..
Here is a quick shot of a run I just did with my fans set @ 7V..Please excuse the fact it is hard to see, I don't know what Photobucket is doing..The picture was 1080P, but they re-sized it way smaller and I can't seem to fix it
The temps are 59, 64, 63, and 62C with an ambient of 23C..I have all the voltages on "Auto" settings aside from a fixed Vcore of 1.128V
..I haven't tried anything lower, this was the stock setting that the MB was feeding the chip when Vcore was set to "Auto"...
In this second shot, I raised the voltage on my Gentle Typhoon AP-15s to their normal 12V..Temps dropped 3-4 degrees, they are 56, 64, 60 and 60C
What do you guys think of these temps? I am blown away!!
Last edited:
C.C. those temperature results are great
One question, the GFlops number itself is low which means the CPU isn't generating as much heat as it should be at that clockspeed with that problem size. Did you run with 8 threads or 4 threads? For max GFlops and max heat generation you want to set IBT to run with only 4 threads.
At 4.5GHz using problem size 43122 I hit 127GFlops with my 3770k. You appear to only be hitting 100Gflops.
I realize my LLC results aren't what people would consider to be typical and I believe it is because of the specific mobo I am using (ASUS MIVE-Z, a $360 spendy sucker).
So for me all my results are with LLC and the Vdroop is pretty much zero, verified by a voltmeter and not software readings.
For example I am running a test right now with the Vcc set to 1.360V, the voltmeter is reading 1.361V actual voltage.
Just curious , where are you taping off on MB to see vcore ?
Just curious , where are you taping off on MB to see vcore ?
On the MIVE-Z mobo there is a set of contact points for external voltage monitoring that ASUS calls the "ProbeIt Belt". You can easily measure the voltage on a number of different components - ram, iGPU, PCH PLL, etc.
- Sep 13, 2008
- 7,407
- 2,440
- 146
C.C. those temperature results are great
One question, the GFlops number itself is low which means the CPU isn't generating as much heat as it should be at that clockspeed with that problem size. Did you run with 8 threads or 4 threads? For max GFlops and max heat generation you want to set IBT to run with only 4 threads.
At 4.5GHz using problem size 43122 I hit 127GFlops with my 3770k. You appear to only be hitting 100Gflops.
Hmm, thanks for the heads up IDC, I ran mine @ 4.4 with similar results, was using 8 threads with HT. As posted in the new thread I made, max was 75 C, but I am not delidded.
Will IBT automatically know to only use physical cores with 4 threads? When I unchecked the "use all logical cores" on OCCT, task manager reported all 8 threads being used, just at 50% :C
On the MIVE-Z mobo there is a set of contact points for external voltage monitoring that ASUS calls the "ProbeIt Belt". You can easily measure the voltage on a number of different components - ram, iGPU, PCH PLL, etc.
Ah, I see , thats nice , and here I was envisioning you probing back of cpu socket
C.C. those temperature results are great
One question, the GFlops number itself is low which means the CPU isn't generating as much heat as it should be at that clockspeed with that problem size. Did you run with 8 threads or 4 threads? For max GFlops and max heat generation you want to set IBT to run with only 4 threads.
At 4.5GHz using problem size 43122 I hit 127GFlops with my 3770k. You appear to only be hitting 100Gflops.
IDC, another guy @ [H] told me the same thing..At the time of these, I was running my ram WAY underclocked @ 1600 11-11-11-2T..I left the thread count on "Auto" and Task Manager showed all 8 threads @ 100% load..
I reran a 25 pass test under Xtreme Mode using all 16GB last night with my ram set to it's XMP profile of 2133 11-11-11-2T, and Gflops came up to 112..Temps for this run were 59,65,64,63C..Once I get my max o/c stable, then I will see what I can do about the ram timings..I think I should be able to tighten them up, or boost the speed to hopefully offset the loose timings..
C C thats nice temps , thats about what I get in prime at 4.0ghz .
What was it before , I assume your doing watercooling ?
I am indeed using water..I have my IHS removed and my cpu block mounted directly on the die of the 3770K using IC Diamond paste as my TIM..I don't remember what my stock temps were, since I planned on a bleeding edge o/c, I was more concerned with removing the IHS for maximum cooling..
BonzaiDuck
Lifer
- Jun 30, 2004
- 15,725
- 1,455
- 126
Hmm, thanks for the heads up IDC, I ran mine @ 4.4 with similar results, was using 8 threads with HT. As posted in the new thread I made, max was 75 C, but I am not delidded.
Will IBT automatically know to only use physical cores with 4 threads? When I unchecked the "use all logical cores" on OCCT, task manager reported all 8 threads being used, just at 50% :C
IDC posted a thread or contributed to one that outlines the procedure for LinX. IBT probably requires the same tweaks. In a nutshell (and IDC could correct me, but easier for him to link his posts), your HT is enabled in BIOS. You'd open Task Manager and then "Resource Monitor"->CPU tab, which will show eight "CPUs" for the four cores under HT. You'd open LinX and choose "4" for number of threads. In Task Manager, choose Processes and find the LinX process; right-click and set the Affinity to cores 0,2,4,6 initially. Set the problem size to accommodate the largest usage of memory, and run briefly to make sure the chosen cores are loading up. If one or more are "parked" per Resource monitor -- and probably after you "stop" the initial LinX run -- you could reset the Affinity settings. Probably watch the the graphs in Resource Monitor to see if there are no loads on every other core or full 100% load on chosen cores.
IDC would have more to add about this. I only know that getting it to work with a standard problem size and memory usage becomes pretty easy; the overall CPU usage should show 50%; and it shows the proper and consistent GFLOPs for each iteration. This can then become a "fine-tuning" tool for setting VCORE so you get the min voltage to provide consistent maximum GFLOPs (after you find out what the maximum should be).
Will IBT automatically know to only use physical cores with 4 threads? When I unchecked the "use all logical cores" on OCCT, task manager reported all 8 threads being used, just at 50% :C
Hi Shmee,
IBT (and likewise LinX) won't know to use only physical cores versus virtual cores, so what you must do is:
1) Set IBT (or LinX) to only use 4 threads from within the setup menu on IBT/LinX.
2) Using task manager, lock the core affinity of IBT/LinX to just one thread per physical core. See this link for a detailed walkthrough.
3) Once IBT/LinX is running the stress test, use task manager and resource monitor to confirm that you are at 50% CPU utilization, if you are not then you need to reassign the core affinity to get around Windows poorly implemented core parking functionality.
Here is a post with proof that you will get higher temperatures.
C.C. those temperature results are great
One question, the GFlops number itself is low which means the CPU isn't generating as much heat as it should be at that clockspeed with that problem size. Did you run with 8 threads or 4 threads? For max GFlops and max heat generation you want to set IBT to run with only 4 threads.
At 4.5GHz using problem size 43122 I hit 127GFlops with my 3770k. You appear to only be hitting 100Gflops.
IDC, I just wanted to drop back in and let you know that I ran IBT @ my now stable speed of 4.8Ghz with both HT on and Off..With HT off, the GFlops did indeed come way up..Contrary to your post, the temps did not increase when I turned HT off..Here are some screen shots..
4.8Ghz @ 1.224V temps were 64,74,74,73C
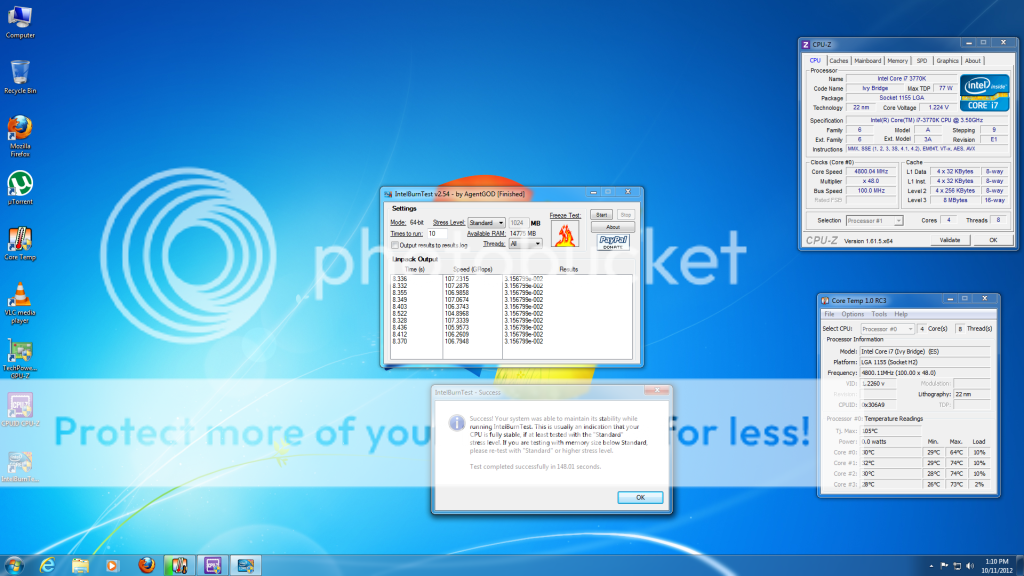
4.8Ghz (4 cores only) 63,74,73,72C..
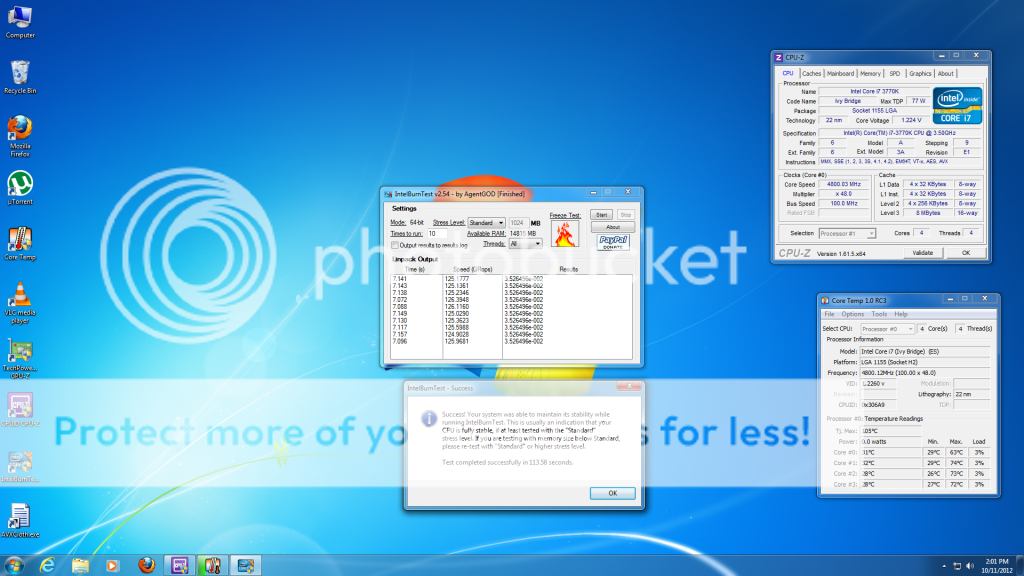
ran 15 passes under Xtreme Mode with all Ram and temps were the same, but I forgot to get a screenshot..I have been able to boot into Windows @ 4.9Ghz, and even run 10 passes under "Standard Mode". but it requires 1.32V, and while 3 of the cores were in the upper 70's, one spiked to 85C for some reason..

Based on this testing, I feel that 4.8Ghz is where I will most likely stay..I was really hoping to see 5Ghz with temps under 85C long term, but the voltage wall with Ivy just isn't going to allow it..It will be interesting to see if Intel does a respin and releases a new stepping, ala the Q600 B3 to G0..I doubt they will, but one can pray to the OverClocking Gods

ran 15 passes under Xtreme Mode with all Ram and temps were the same, but I forgot to get a screenshot..I have been able to boot into Windows @ 4.9Ghz, and even run 10 passes under "Standard Mode". but it requires 1.32V, and while 3 of the cores were in the upper 70's, one spiked to 85C for some reason..
Based on this testing, I feel that 4.8Ghz is where I will most likely stay..I was really hoping to see 5Ghz with temps under 85C long term, but the voltage wall with Ivy just isn't going to allow it..It will be interesting to see if Intel does a respin and releases a new stepping, ala the Q600 B3 to G0..I doubt they will, but one can pray to the OverClocking Gods
Contrary to your post, the temps did not increase when I turned HT off..
My post had nothing to do with turning HT off. I have never turned off HT, not even once, in all my years of testing.
If you are truly turning off HT in the BIOS then I would not be surprised if the temperatures do not increase, you are disabling circuits that would otherwise be using power servicing all the background processes that windows is executing while IBT is running flat-out on the four physical cores.
Once you turn off HT, those background processes begin to compete with CPU cycles from IBT. You don't want that.
Your GFlops will increase even further if you leave HT enabled but restrict IBT/LinX to only four threads (it is in the setup menu, see the link in my post above where I document exactly how to set it up) while leaving the virtual cores available to service everything else your system is doing in the background.
More crucially though is to not loose sight of the reason why you are stress testing in the first place.
If it is to compare peak temperatures in an apples-to-apples comparison for your own setup as you change things within your setup then all that matters is that you are consistent in your methodology from run to run.
If it is to compare peak temperatures in an apples-to-apples comparison with other people's rigs then it is imperative that you run the exact same problem size and exact same thread/core affinities and so forth, otherwise your heat generation won't be the same and thus the cooling efficiency won't be comparable.
Take a look at the following formula which describes the power-consumption of a CPU:
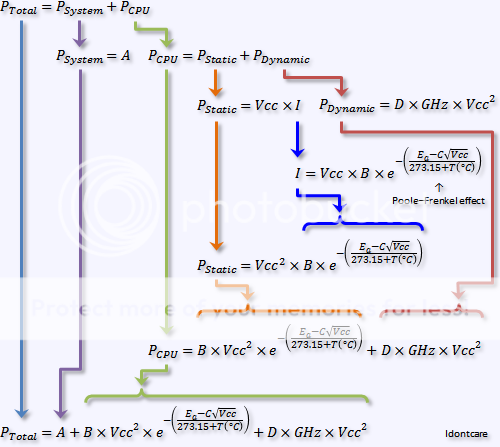
Take note of the formula for dynamic power consumption (Pdynamic on the far right), notice that it has a premultiplier coefficient that I have called "D" in this case.
In computer science that coefficient is referred to as the "activity factor" which is a measure of how many transistors are actually being actively switched during the computations. It is dependent on the specific instructions that are being executed, and the efficiency of the pipeline (IPC).
The point of us both using the same program (IBT/LinX) for stress testing is so that we both have the same activity factor (the same value for D) for our rigs such that the dynamic power consumption of our CPU's is the same on a voltage-normalized an clockspeed-normalized basis.
One way of knowing we have the same D is for us to compare the results of the program - GFlops. The only way to arrive at the same GFlops value is for the CPU to have computed exactly the same number of instructions, and the same instructions themselves, in the same amount of time.
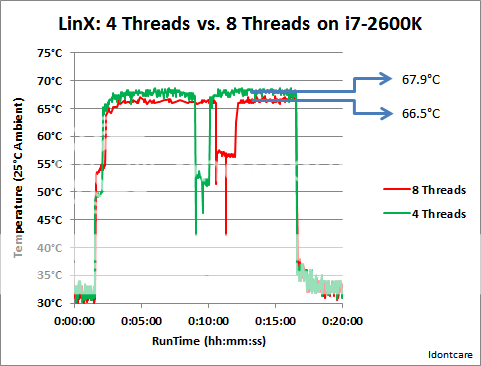
One last note - don't rely on peak temperatures to be indicative of the average temperature for the cores when testing HT on versus off. Peak readings are very spurious, you need to use coretemp and have it save the data to a file that you can then analyze as I did to create the graph. Only then will you see the bigger picture of what kind of thermal environment your CPU's circuits are operating in during the stress test.
Last edited:
TRENDING THREADS
-
 Discussion Intel current and future Lakes & Rapids thread
- Started by TheF34RChannel
- Replies: 23K
-
 Discussion Zen 5 Speculation (EPYC Turin and Strix Point/Granite Ridge - Ryzen 9000)
- Started by DisEnchantment
- Replies: 10K
-
 Discussion Speculation: Zen 4 (EPYC 4 "Genoa", Ryzen 7000, etc.)
- Started by Vattila
- Replies: 13K
-
Discussion Intel Meteor, Arrow, Lunar & Panther Lakes Discussion Threads
- Started by Tigerick
- Replies: 7K
-

AnandTech is part of Future plc, an international media group and leading digital publisher. Visit our corporate site.
© Future Publishing Limited Quay House, The Ambury, Bath BA1 1UA. All rights reserved. England and Wales company registration number 2008885.